Analysis Of Grouped Data
90 likes | 326 Vues
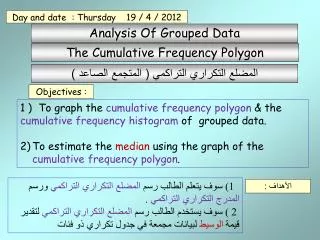
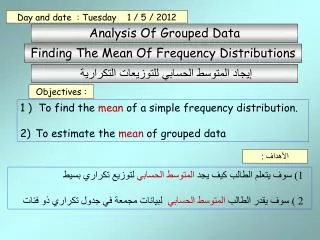
Day and date : Tuesday 1 / 5 / 2012. Analysis Of Grouped Data. Finding The Mean Of Frequency Distributions. إيجاد المتوسط الحسابي للتوزيعات التكرارية. Objectives :. 1 ) To find the mean of a simple frequency distribution. To estimate the mean of grouped data. الأهداف :.

Analysis Of Grouped Data
E N D
Presentation Transcript
Day and date : Tuesday 1 / 5 / 2012 Analysis Of Grouped Data Finding The Mean Of Frequency Distributions إيجاد المتوسط الحسابي للتوزيعات التكرارية Objectives : • 1 ) To find the mean of a simple frequency distribution. • To estimate the mean of grouped data الأهداف : 1) سوف يتعلم الطالب كيف يجد المتوسط الحسابي لتوزيع تكراري بسيط 2 ) سوف يقدر الطالب المتوسط الحسابي لبيانات مجمعة في جدول تكراري ذو فئات
∑ x 2 + 7 + 9 + 5 + 7 + 8 + 4 + 6 48 Mean = n 8 8 Day and date : Thursday 19 / 4 / 2012 Finding The Mean Of Frequency Distributions إيجاد المتوسط الحسابي للتوزيعات التكرارية Startar Activity : نشاط البداية : Find the mean of the following set of data : اوجد المتوسط الحسابي لمجموعة القيم التالية : 2 , 7 , 9 , 5 , 7 , 8 , 4 , 6 = 6 = =
Mean from a Frequency Table Example 1. Ali bought 20 books , the prices are given in the table below find the mean price. اشترى علي 20 كتاب والأسعار مبينة في الجدول ادناه ، اوجد المتوسط الحسابي لأسعار الكتب. price(DHS ) x Frequency, f f.x 50 3 125 4 ∑ f • x 2850 7 150 Mean = 20 Σ f 3 175 200 2 225 1 150 500 1050 525 400 = 225 = 142.5 DHS ∑f= 20 ∑fx= 2850
Grouped Data Estimating the Mean:An estimate for the mean can be obtained by assuming that each of the raw data values takes the midpoint value of the interval in which it has been placed. Example 1. During 3 hours at Dubai airport 60 aircraft arrived late. The number of minutes they were late is shown in the grouped frequency table below. minutes Late Frequency,f midpoint(c.c.) f × c.c. 0 - 9 12 10 - 19 16 ∑ f × c.c 20 - 29 18 1280 Mean = 60 Σ f 30 - 39 8 40 - 49 5 50 - 59 1 4.5 54 232 14.5 441 24.5 34.5 276 44.5 222.5 = 54.5 54.5 ∑f= 60 ∑ f × c.c = 1280 ≈ 21.33 min.
Mohamad badawi hamadaa_math@yahoo.com Worksheet ( 1 ) The ages of a random sample of 30 persons are given in the table : أعمار عينة عشوائية من 30 شخص كما بالجدول : 1) اكمل الجدول 1) Complete the table 2) اوجد المتوسط الحسلبي للأعمار 2) Find the mean age
∑ f • x Mean = Σ f Mohamad badawi hamadaa_math@yahoo.com Worksheet ( 1 ) The ages of a random sample of 30 persons are given in the table : أعمار عينة عشوائية من 30 شخص كما بالجدول : 1) اكمل الجدول 1) Complete the table 2) اوجد المتوسط الحسلبي للأعمار 2) Find the mean age
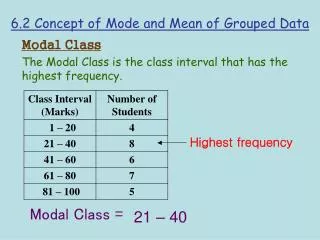
Mohamad badawi hamadaa_math@yahoo.com Worksheet ( 2 ) The following frequency distribution represents the lengths ( cm ) of 20 persons التوزيع التكراري يمثل أطوال 20 شخص أوجد : Find : 1) المتوسط الحسابي للأطوال 1) The mean of the lengths 2) The model class and estimate the mode 2) اكتب الفئة المنوالية وقدر المنوال 3) The range of the lengths 3) أوجد مدى الأطوال
∑ f × c.c Mean = Σ f Mohamad badawi hamadaa_math@yahoo.com Worksheet ( 2 ) The following frequency distribution represents the lengths ( cm ) of 20 persons التوزيع التكراري يمثل أطوال 20 شخص أوجد : Find : 1) المتوسط الحسابي للأطوال 1) The mean of the lengths 2) The model class and estimate the mode 2) اكتب الفئة المنوالية وقدر المنوال 3) The range of the lengths 3) أوجد مدى الأطوال
Worksheet ( 3 ) Mohamad badawi hamadaa_math@yahoo.com The frequency histogram below shows the grades of 25 students ( term 2 results ) Complete the table then estimate the mean of the grades. نتائج احد الفصول بنهاية الفصل الدراسي الثاني مبينة بالمدرج التكراري ادناه ، اكمل الجدول التالي ثم قدر المتوسط الحسابي لهذه الدرجات 7 6 5 4 3 2 1 90 100 80 70 60 40 50