Download
1 / 40
1.57k likes | 5.27k Vues
Mean, Median, Mode, and Midrange of Grouped Data. Section 2.5. Grouped Data……. You must add one more column than you did using ungrouped data. You now need a midpoint column. The symbol for the midpoint is. Formulas……Mean. Mean. Median.

E N D
Mean, Median, Mode, and Midrange of Grouped Data Section 2.5
Grouped Data…… • You must add one more column than you did using ungrouped data. • You now need a midpoint column. • The symbol for the midpoint is .
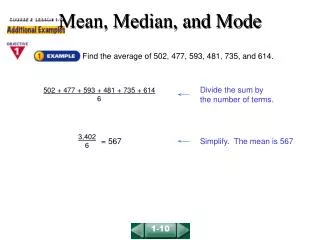
Formulas……Mean • Mean
Median • There IS a formula to find the median using grouped data.
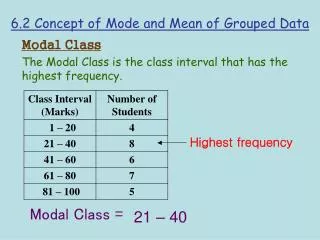
Mode…… • Find the greatest frequency and read across the chart until you see the class that corresponds to it. • Your answer will be the entire interval.
Midrange….. • Add the lowest number in the first row to the highest number in the last row. • Divide that answer by 2.
Example….. • Find the mean, median, and mode of the set of grouped data.
Median….. • n/2 = 20/2 = 10
Mode and Midrange…… • The mode is 21-26. • Midrange =
Now you try………. • Find the mean, median, and mode of the following set.
Mode…….. • The mode is 69-72.
Midrange…….. • The midrange = (63 + 78)/2 = 70.5
Range, Variance and St. Deviation – Grouped Section 2.5
Grouped Data…… • Variance Formula
Range….. • High number in last row minus low number in first row.
Example…… • Find the variance, standard deviation, and range of the set.
Calculator Steps…… • Put lower boundaries in L1 and upper boundaries in L2. Put frequencies in L3. Set a formula for midpoint in L4.
Range = High - Low • Range = 32 – 2 = 30
Example…… • Find the mean, median, mode, midrange, range, variance, and st. deviation of the data set.
Mode…… • Greatest Frequency is 9. • Mode = 15-20
Homework……. • Find the measures of center and variation for the grouped data on HW3.