Download
1 / 10
100 likes | 203 Vues
Electricity Distribution Debate Kit Starter (logo, etc ). How has energy consumption changed over time? What about energy sources?. Wikimedia Commons. So, how much energy do we use in a week?. WHY ?. Source: http://www.gridwatch.templar.co.uk/. DEMAND = PRODUCTION.

E N D
Electricity Distribution Debate Kit Starter (logo, etc)
How has energy consumption changed over time? What about energy sources? Wikimedia Commons
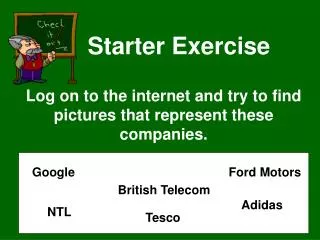
So, how much energy do we use in a week? WHY? Source: http://www.gridwatch.templar.co.uk/
DEMAND = PRODUCTION CCGT= combined cycle gas turbines Source: http://www.gridwatch.templar.co.uk/
How do different sources of energy compare to each other? Nuclear energy production is very steady Windenergy production is very variable, as it depends on the weather CCGTis used to match up the difference between demand and production Source: http://www.gridwatch.templar.co.uk/ CCGT= combined cycle gas turbines
How does energy go from the power station to your home? Pictures from Wikimedia Commons
Electricity Transmission Electricity Distribution Adapted from: http://www.energynetworks.org/modx/assets/files/electricity/she/environment/briefing_notes/ENV2TransportingElectricity.pdf
Energy is often produced far from where it is most needed UK’s nuclear stations UK’s main cities UK Energy Watch
Energy is often produced far from where it is most needed Generation Demand Energy flow Population Office of National Statistics 2011 ACS Power Flow Pattern 2009/2010