April 4
April 4. Logistic Regression Lee Chapter 9 Cody and Smith 9:F. HRT Use and Polyps. Case (Polyps). Control (No Polyps). HRT Use. 247. No HRT Use. 216. 174. 289. 463. RO HRT Use (Case v Control). RO = 72/102 175/114. c 2 = ( 463 ) (RO) 2 ( 174) (289) (247) (216).

April 4
E N D
Presentation Transcript
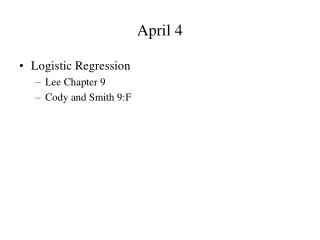
April 4 • Logistic Regression • Lee Chapter 9 • Cody and Smith 9:F
HRT Use and Polyps Case (Polyps) Control (No Polyps) HRT Use 247 No HRT Use 216 174 289 463 RO HRT Use (Case v Control) RO = 72/102 175/114 c2 = ( 463 ) (RO)2 ( 174) (289) (247) (216) = 0.46 =16.04
Inference for binary data • Relative risk, odds ratios, 2x2 tables are limited • Can’t adjust for many confounders • Limited to categorical predictors • Can’t look at multiple variables simultaneously • Logistic regression • Adjust for many confounders • Study continuous predictors • Model interactions
Linear regression model Y = bo + b1X1 + b2X2 + ... + bpXp Y = dependent variable Xi = independent variables Y is continuous, normally distributed Model the mean response (Y) based on the predictors b0 is mean of Y when all Xs are 0 b1 is increase in mean of Y for increase in 1 unit of X
New regression model? Y?=bo + b1X1 + b2X2 + ... + bpXp Y = binary outcome (0 or 1) Xi = independent variables Would like to use this type of model for a binary outcome variable
What if you had multiple observationsat each Score (or you grouped scores) Score Proportion Dying < 10 1/10 = 0.10 11-20 4/15 = 0.27 21-30 5/15 = 0.33 31-40 8/16 = 0.50 * * * *
Possibilities for Y Y?=bo + b1X1 + b2X2 + ... + bpXp Y = probability of Y = 1 (Problem: Y bound by 0 -1) Y = odds of Y = 1 Y = log (odds of Y = 1) – Has good properties
Probability, Odds, Log Odds p Odds (p/(1-p)) Log (Odds) 0.01 0.01 -4.60 0.10 0.11 -2.20 0.20 0.25 -1.38 0.30 0.43 -0.85 0.40 0.63 -0.41 0.50 1.00 0.00 0.60 1.50 0.41 0.70 2.33 0.85 0.80 4.00 1.38 0.90 9.00 2.20 0.99 99.00 4.60 Less extreme values and symmetric about p=0.5 Bound by 0 -1 Extreme Values
Logistic regression equation Model log odds of outcome as a linear function of one or more variables Xi = predictors, independent variables The model is:
A Little Math • The natural LOG and exponential (EXP) functions are inverse functions of each other • LOG (a) = b EXP (b) = a • LOG (1) = 0 EXP(0) = 1 • LOG (.5) = -0.693 EXP(-.693) = .5 • LOG (1.5) = .405 EXP(.405) = 1.5 These will be logistic regression betas These will be the odds ratios Note: Calculators and Excel use LN for natural logarithm
A Little Math • LOG function • Takes values [ 0 to +infinity] [-infinity to +infinity] • EXP function • Takes values [ -infinity to infinity] [0 to +infinity]
A Little Math • Properties of LOG function • log (a*b) = log (a) + log (b) • log (a/b) = log (a) – log (b) • Properties of EXP function • exp (a+b) = exp(a) * exp(b) • exp (a-b) = exp(a)/exp(b) Odds Ratios Differences in log odds
These will be the odds ratios These will be typical betas from the logistic regression model
Logistic regression – single binary covariate We need to use a dummy variable to code for men and women x = 1 for women, 0 for men What do the betas mean? What is odds ratio, women versus men? The model is:
Odds for Men and Women For men; For women; b1 is difference in log odds between men and women After some algebra, the odds ratio is equal to;
Example - risk of CVD for men vs. women log(odds) = b0 + b1x = -2.5504 - 1.0527*x For females; log(odds) = -2.5504 - 1.0527(1) = -3.6031 For males; log(odds) = -2.5504 - 1.0527(0) = -2.5504 exp(b1) = odds ratio for women vs. men Here, exp(b1) = exp(-1.0527) = 0.35 Women are at a 65% lower risk of the outcome than men (OR<1) Dif = -1.0527
Note • Odds ratio from 2 x 2 table • EXP (b) from logistic regression for binary risk factor • These will be equal
Multiple logistic regression model log(odds) = bo + b1X1 + b2X2 + ... + bpXp log(odds) = logarithm of the odds for the outcome, dependent variable Xi = predictors, independent variables bi - log(OR) associated with either • exposure (for categorical predictors) • a 1 unit increase in predictor (for continuous) OR adjusted for other variables in model
Interpretation of coefficients - continuous predictors Example - effect of age on risk of death in 10 years log(odds) = -8.2784+ 0.1026*age b0 = -8.2784, b1 = 0.1026 exp(b1) = exp(0.1026) = 1.108 A one year increase in age is associated with an odds ratio of death of 1.108 (assumption that this is true for any 2 consecutive ages) This is an increase of approximately 11% (= 1.108 - 1)
Interpretation of coefficients - continuous predictors What about a 5 year increase in age? Multiply coefficient by the change you want to look at; exp(5*b1) = exp(5*0.1026) = 1.67 A five year increase in age is associated with an odds ratio of death of 1.67 This is an increase of 67% Note: exp(5*b1) does not equal 5*exp(b1)
Parameter Estimation • How do we come up with estimates for bi? • Can’t use least squares since outcome is not continuous • Use Maximum Likelihood Estimation (MLE)
Maximum Likelihood Estimation • Choose parameter estimates that maximize the probability of observing the data you observed. • Example for estimation a proportion p • Observe 7/10 have characteristic • P = 0.70 is estimate p • P = 0.70 is MLE of p (Why?) • Which value of p maximizes the probability of getting 7 of 10? • Answer: 0.70
MLE Simple Example • Wish to estimate a proportion p • Sample n = 2 • Observe 1 of 2 have characteristic • L = p (1-p) • What value of p maximizes L? • Answer: p = 0.5 which is p=1/2
Fitted regression line Curve based on: bo effects location b1 effects curvature
Inference for multiple logistic regression • Collect data, choose model, estimate bo and bis • Describe odds ratios, exp(bi), in statistical terms. • How confident are we of our estimate? • Is the odds ratio is different from one due to chance? Not interested in inference for bo (related to overall probability of outcome)
Confidence Intervals for logistic regression coefficients • General form of 95% CI: Estimate ± 1.96*SE • Bi estimate, provided by SAS • SE is complicated, provided by SAS • Related to variability of our data and sample size
95% Confidence Intervals for the odds ratio • Based on transforming the 95% confidence interval for the parameter estimates • Supplied automatically by SAS • Look to see if interval contains 1 “We have a statistically significant association between the predictor and the outcome controlling for all other covariates” • Equivalent to a hypothesis test; reject Ho: OR = 1 at alpha = 0.05. Based on whether or not 1 is in the interval
Hypothesis test for individual logistic regression coefficient • Null and alternative hypotheses • Ho : bi = 0, Ha: bi 0 • Test statistic: c2 = (bi/ SE)2, supplied by SAS • p-values are supplied by SAS • If p<0.05, “there is a statistically significant association between the predictor and outcome variable controlling for all other covariates” at alpha = 0.05
PROC LOGISTIC PROCLOGISTICDATA = dataset; MODELoutcome = list of x variables; RUN; • CLASS statement allows for categorical variables with many groups (>2)
DATA temp; INPUT apache death @@ ; xdeath = 2; if death = 1then xdeath = 1; DATALINES; 0 0 2 0 3 0 4 0 5 0 6 0 7 0 8 0 9 0 10 0 11 0 12 0 13 0 14 0 15 0 16 0 17 1 18 1 19 0 20 0 21 1 22 1 23 0 24 1 25 1 26 1 27 0 28 1 29 1 30 1 31 1 32 1 33 1 34 1 35 1 36 1 37 1 38 1 41 0 ; PROCLOGIST DATA=temp; MODEL xdeath = apache; RUN;
The LOGISTIC Procedure Model Information Data Set WORK.TEMP Response Variable xdeath Number of Response Levels 2 Number of Observations 39 Model binary logit Optimization Technique Fisher's scoring Response Profile Ordered Total Value xdeath Frequency 1 1 18 2 2 21 Probability modeled is xdeath=1.
The LOGISTIC Procedure Analysis of Maximum Likelihood Estimates Standard Wald Parameter DF Estimate Error Chi-Square Pr > ChiSq Intercept 1 -4.3861 1.3687 10.2686 0.0014 apache 1 0.2034 0.0605 11.3093 0.0008 Odds Ratio Estimates Point 95% Wald Effect Estimate Confidence Limits apache 1.226 1.089 1.380 EXP(0.2034 – 1.96*.0605) EXP(0.2034) EXP(0.2034 +1.96*.0605)
TOMHS – bpstudy sas dataset • Variable CLINICAL (1=yes, 0 =no) indicates whether patient had a CVD event • Run logistic regression separately for age and gender to determine if: • Age is related to CVD • What is the odds associated with a 1 year increase in age • What is the odds associated with a 5 year increase in age • Gender is related to CVD • What is the odds of CVD (women versus men) • Run logistic regression for age and gender together • Note: Download dataset from web-page or use dataset on SATURN