Download

1 / 32
320 likes | 465 Vues
Model Aloft Study Ola Persson, Jian-Wen Bao, Sara Michelson Jim Wilczak NOAA/ Environmental Technology Laboratory. Motivation Model simulations for California have usually underestimated ozone concentrations aloft CCOS IOP simulations have under-predicted surface ozone concentrations

E N D
Model Aloft StudyOla Persson, Jian-Wen Bao,Sara MichelsonJim WilczakNOAA/ Environmental Technology Laboratory
Motivation • Model simulations for California have usually underestimated ozone concentrations aloft • CCOS IOP simulations have under-predicted surface ozone concentrations • Hypotheses • Improper IC and BC’s • Insufficient model resolution • Too strong winds in stagnant conditions • Too weak of mixing of PBL O3 to layers above • Too weak recirculation of upslope flow back over CV • Errors in characterization of chemistry • Emissions
NOAA & STI Components • NOAA: O3 & meteorological fields • initial and boundary conditions • meteorological dependent O3 formation • mixing • transport • STI: all chemical species • initial and boundary conditions • chemical mechanism • emissions
Planned Analysis (NOAA) • MM5-CAMx and Hybrid comparisons for July-August and September 2000 IOP’s (utilizing ozone aloft data as well as meteorological obs) • Produce new simulations with WRF-Chem model • Run additional simulations with improved MM5-CAMx model.
CAMx Experiments • 'A60' MM5 without observational FDDA • 'A59' MM5 with observational FDDA • 'A53' meteorology from the CALMET/MM5 hybrid • The two MM5-CAMx simulations used 40ppbv lateral and top boundary conditions • Hybrid run used a truncated model to 5 km, with 70ppbv lateral and top boundary conditions
Ozone sonde evaluationJuly-August IOP • Parlier (16 sondes) • Granite Bay (12 sondes)
Parlier MM5 MM5- FDDA Hybrid Sonde
Parlier Bias MM5 MM5-FDDA Hybrid
Granite Bay MM5 MM5- FDDA Hybrid Sonde
Granite Bay Bias MM5 MM5- FDDA Hybrid
Parlier Model Sonde Bias Hybrid MM5-FDDA
Granite Bay Hybrid MM5-FDDA
Bias MM5 MM5-FDDA Hybrid Granite Bay Parlier
RMS difference MM5 MM5-FDDA Hybrid Granite Bay Parlier
Correlation Coefficient Cor Coef Cor Coef Parlier Granite Bay
Biggest differences aloft among 3 models are due to larger O3 value used as lateral and top boundary conditionWhat is the most appropriate value for BC for ozone?
Trinidad Head Summer 2000 11 soundings
Median ozone profiles at all IONS sites, July 1 – August 15, 2004 Summer 2004 Ozone Sondes Owen Cooper, AL/NOAA
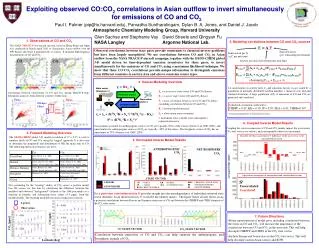
Asian Plume Qing Liang/UW
Observed Chemical Composition of Asian Plumes Qing Liang/UW
TH ozone sondes suggest that mean tropospheric lateral bc’s should be approximately 60 ppbv • Significant departures from 60 ppbv can occur due to tropopause folding events and due to asian plumes • Significant height variation exists in the mean TH profile, especially in lowest 2 km
NWS Eta-CMAQ Boundary Conditions • CMAQ-Eta simulations for the summer of 2004 in New England over-predicted surface ozone by ~10 ppb. Mathur (2005) traced this bias to too high of ozone values for lateral and top boundary conditions. • Present CMAQ-Eta operational model uses O3 lateral and top boundaries from the GFS global model for heights > 6km, climatology below.
Satellite Measurements of Chemical Species • O3 • CO • CH4 • CO2 • NO2 • HCHO • SO2 • AOD, etc. • AIRS • MODIS • SCIAMACHY • MOPITT • GOME, etc.
Recommended areas of investigation – High bias at coastal sites and over land at night • Sensitivity tests to height-dependent O3 profile in initial state and at lateral inflow boundaries • Vertical resolution of CAMx near surface • Chemical deposition over water • Kz in stable conditions • Chemical processing in off-shore stratus(?)
Recommended areas of investigation – Low bias at land sites during day • Sensitivity tests to larger O3 lateral and top boundary values (30-110 ppbv) • Higher vertical resolution chemistry model simulation to reduce mixing between PBL and aloft
Next steps • Analyze day and night profile statistics separately at Parlier and Granite Bay • Compare 3 models with Trinidad Head O3 soundings • Compare 3 models with aircraft observations • Repeat analysis using MM5-CMAQ from Seasonal Modeling study • Add MM5-CAMx runs using hourly averaged model winds • Add WRF-Chem run using CARB emission inventory • Repeat all of analysis for September IOP