Experimental Products on TC- Realtime
90 likes | 201 Vues
Explore aspects of tropical cyclone structure based on real-time data. Learn how the size, intensity, and pressure of TCs are estimated using innovative methods and technology. Interpret Simplified Holland B (SHB) values and their significance in forecasting. Case studies like Typhoon Abe and Hurricane Kay provide insights into TC variability.

Experimental Products on TC- Realtime
E N D
Presentation Transcript
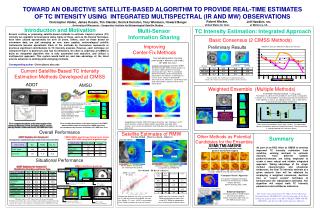
Aspects of Tropical Cyclone Structure • TC size • Simplified Holland B (Knaff et al. 2011) • Based upon information in the TC bogus/vitals provided by NHC/JTWC (translation speed, vmax, R34, latitude, ROCI) • Estimate mslp (Knaff and Zehr 2007) • Calculated ΔP using ROCI • Adjust Vmax for translation speed • Estimate SHB • IR-based TC size (i.e., the radius of where the TC wind field is indistinguishable from the background flow in a climatological environment) • Based on 1-D Principle Components of the IR imageryand latitude
Simplified Holland B (SHB) e is the basis of the natural logarithm c is the translation speed and Vmax is the intensity [kt] Δp = mslp –POCI, mslp based on Knaff and Zehr (2007) • Knaff et al. (2011), Wea. Forecasting
Interpretation of SHB Higher values of the SHB are associated with vortices with compact tangential wind profiles and intense maximum tangential winds. Lower values of the SHB are associated with vortices with broad tangential wind profiles and weaker maximum tangential winds SHB appears to be insensitive to changes in RMW when other factors are held constant.
Dorian (2013) Started out a broad circulation As it intensified the circulation became more compact Shows some diurnal oscillations near formation
IR TC Size Knaff et al. (2013), in review, J. Climate
Figure 2. IR images of Typhoon Abe (1990) located at 25.2oN, 124.8oE with an intensity of 90 kt on 30 August 1990 at 0000 UTC and Hurricane Kay (1998) located at 16.0oN, 123.8oW with an intensity of 65 kt on 13 October 1998 at 1800UTC. These represent the largest and smallest hurricane intensity TCs in our dataset.
Dorian (2013) Grew initially during intensification Has become smaller since being named and while moving across the central Atlantic