Writing About Numbers
140 likes | 165 Vues
Learn how to effectively communicate numerical data in research, reports, and presentations. Understand the importance of context, clear explanations, and visual aids in conveying relationships and projections. Follow essential tips for structuring paragraphs and interpreting numbers to enhance your writing skills.

Writing About Numbers
E N D
Presentation Transcript
Writing About Numbers With excerpts From Miller (2005)
Writing About Numbers • What is the point? • What does it contribute? These are basic elements to keep in mind for any research or report.
Objectives • To provide information to an applied audience. • Add context to an empirical investigation. • Analyze relationships among several variables. • To generate projections.
For example (Miller 2005, 4): • A few facts in the abstract or intro of a journal article • Table & description in the analytic section of a report (journal or report) • Speech or poster presentation • Issue brief or grant proposal
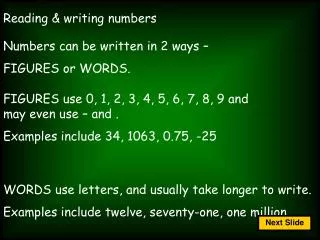
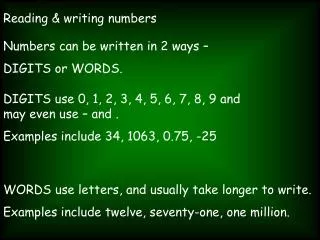
Writing well, reading well “Writing effectively about numbers also involves reading effectively about numbers.” “To select and explain numbers for your work, you must understand what those numbers mean and how they were measured or calculated.” (Miller 2005, 5)
Writing about numbers… • Is no different than other writing. • Clear, concise, logical order; consistent • No “plunking a number or two in the middle of a sentence.” • Consider: • General image of a pattern? • Specific, detailed information? • Single number or many numbers?
Tools in the toolbox • In-text, tables, or charts. • Among several options, one is usually best. • Use a simpler display or example if your audience only has 30 seconds to grasp the numerical relationship. • Does your audience need detail? • Use a table rather than sentences.
Writing about numbers • Often describing the relationships between two or more variables. • Explain both shape and size of the association, not just that there is a correlation. • Give the direction and size of association. • Is one group bigger? How much bigger?
Claim, Evidence, Warrant “When writing about numbers, help your readers see where those numbers fit into the story you are telling - how they answer some question you have raised. A naked number sitting alone and un-interpreted is unlikely to accomplish its purpose. Start each paragraph with a topic sentence or thesis statement….Structure your paragraphs so your audience can follow how each section and each number contribute to the overall scheme” (Miller 2005, 7).
Writing & research is iterative • Initial choices of tools, variables, may be less effective than you first thought • You may need to condense something detailed or technical into bullets or an executive summary • Draft tables & charts on paper or white board first • Outline key findings before complex patterns
Some helpful tips & hints • Proportion of a whole • Proportion is .50; percent is 50% • Be sure to explain what the whole is • The denominator • Percentage of what…..
Example 1 “In 1996, of the 146 million registered voters, 63% participated in the U.S. presidential election.” • Which part is the whole, which part is the proportion? • Graphic Display - Pie chart
Example 2 “In 2002, 16.7% of children in the United States were poor.” “In 2002, 16.7% of children were poor, compared to 10.6% of people aged 18 to 64, and 10.4% of those aged 65 or older.” Graphic display - cross-tablulation table