Download
1 / 13
130 likes | 352 Vues
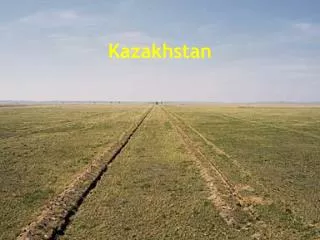
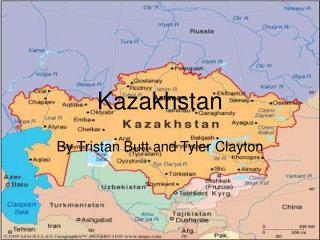
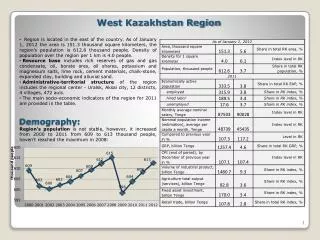
West Kazakhstan Region. Region is located in the east of the country. As of January 1, 2012 the area is 151 . 3 thousand square kilometers, the region's population is 612 . 6 thousand people . Density of population over the region per 1 km is 4 . 0 people .

E N D
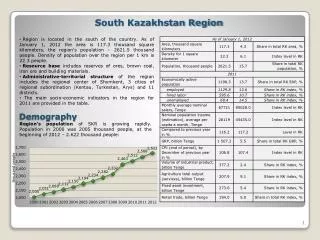
West Kazakhstan Region • Region is located in the east of the country. As of January 1, 2012 the area is 151.3 thousand square kilometers, the region's populationis 612.6 thousand people. Density of population over the region per 1 km is 4.0 people. • Resource base includes rich reservesof gas andgas condensate, oil, borate ores, oil shares, potassium and magnesium salts, lime rock, cement materials, chalk-stone, expanded clay, building andalluvial sand. • Administrative-territorial structure of the region includes the regional center - Uralsk, Aksai city, 12 districts, 4 villages, 472 auls. • The main socio-economic indicators of the region for 2011 are provided in the table. Demography: Region’s population isnot stable, however, it increased from 2000 to 2011 from 609 to 613 thousand people, haven’t reached the maximum in 2008: 1
Economically active population (EAP) • The number of employed population increases and unemployed population falls in both absolute and relative terms. For 10 years, from 2001 to 2011, the employed population has increased from 88 to 95%, while the number of unemployed has fallen from 13 to 5%. • Characteristic feature of the employed population dynamics is the growth of hired labor and the reduction of self-employed people. From 2001 to 2011 the number of hired labor increased from 55% to 60%, the number of self-employed people fell from 45 to 40%. EAP and employed people structure corresponds to the average in Kazakhstan: EAP of the region is increasing at a moderate pace and in 2011 it reached 333.5 thousand people. 315.9 thousand people of them are employed, 17.6 thousand people – unemployed.Economically inactive population made up 146.3 thousand people, it is lower than the level in 2000:
The changes of employed population structure are supported by a strong tendency of unemployment rate reduction from maximum 12.5% in 2001 to 5.3% in 2011 and poor increase in economic activity of the population: • In 2011 unemployment rate of WKR region was below the average in Kazakhstan – 5.4%: Unemployment Level
Quality of Life • Cost of living has been growing steadily since 2003, but the value is below the average in RK: • Life expectancy at birth in the region is increasing, and equals the average in Kazakhstan in general: • Some of life quality indicators in 2011: • Share of population with income used for consumption below the poverty line is 2011 it was below the average in RK: decreasing and in
Enrollment • Enrollment share of the population aged 6-24 years has increased from 2001 and the values exceed the average in RK significantly: • The number of children in regular preschools has significantly increased since 2001: • The umber of students in technical and vocational education is increasing: • The number of students in higher educationhas been growing steadily since 2008:
Monthly average nominal salary per employee for 2011 is 87,503 Tenge, that is below the country’s average – 90,028 Tenge: • In the dynamics the average nominal salary per employee and the average nominal income per capita are ever-growing. City of Almaty City of Astana East Kazakhstan North Kazakhstan Pavlodar South Kazakhstan Mangistau Kyzylorda Kostanay Karaganda Zhambyl West Kazakhstan Atyrau Almaty Aktobe Akmola • The index of the nominal and real incomes showed a decline in 2006,during the crisisyear 2009. In 2006the growth of nominal income was less than the consumer price index, i.e. revenue growth did not cover inflation: Population Income
GRP growth in 2011 is slightly below the average growth of total GRP of all regions of Kazakhstan and makes up 126.2% compared to 2010, against the total value of RK - 126.4%: • GRP is growing steadily, its share in total GRP of all regions increasedfrom 4.6% in 2000 to 4,8% in 2011 : City of Almaty City of Astana East Kazakhstan North Kazakhstan Pavlodar South Kazakhstan Mangistau Kyzylorda Kostanay Karaganda Zhambyl West Kazakhstan Atyrau Almaty Aktobe Akmola Economy
The growth of fixed assets investment in 2011 exceeded significantly the average levelin all RK regions and made upthe negative value of 73% compared to the previous year,against 107.7% in general in RK: • Fixed assets investmentdoesn’t show stable dynamics. The values have been decreasing since 2009: • The share of fixed assets investment in the Kazakhstan’s level of investment has fallen significantly from 22.1% in 2000 to 3.4% in 2011: Investment
The volume of production in agriculture was increasing until 2008. In 2010 the value was 52.8 billion Tenge: • The share of the region’s volume of production in agriculture in total Kazakhstan’s volume of industry’s production in 2010 made up 3.7% of country’s agricultural production: Agriculture
The growth of industrial production volumes was observed throughout the study period, excluding crisis year 2009, when mining industry showed a decrease: • Real sector industries with the highest values of production in 2010 areproduction of crude oil and natural gas, construction, manufacture of coke and refined petroleum products, and other mining industries and etc.These industries have significant share of total production in the Republic of Kazakhstanand region’s GRP: • The share of industrial production in the Kazakhstan’s level has increased from 4.5% in 2000 to 9.3% in 2011: Real Sector
Small and Medium Business • The number of registered legal entities as of October 1, 2012 is 8160. The SME number is 8082. The structure of the enterprises number is close to the RK average level: • SME share of the region's GRP decreasedsharply in 2011 and became lower the average level in RK:
Interbudgetary Relations • Budget revenues of West Kazakhstan region in 2011 amounted to94.5 trillion Tenge, including 55.1 trillion Tenge of transfers from the national budget. Expenses amounted to 98.0 trillion Tenge, including 0.6 trillion Tenge of transfers to the national budget. Thus, the region is subventional:
Main target indicators: • Ensure the economic growth of the region in real terms to 112.2%in 2015 compared to the level at 2009; • The share of manufacturing in GRP in 2015 shall be not less than 5.0%; • The share of non-resource exports in total exports by 2015 shall be not less than 15.0%; • The labor productivity in the manufacturing industry shall increase by 1.8 times of 2009 level; • Reduction of energy intensity of GRP at least by 10%; • Gas production rate shall be 103.8% in 2015 ; • The production volume of construction materials in 2015 shall be 10,044 million Tenge, or more than level at 2009 by 69.7%; • Increase GVA in agro industrial complex by 21% in 2015 compared to 2009; • Increase the labor productivity in agriculture by 2 times in 2015 compared to 2009; • Increase the share of SMEs in GRP to 15.7% in 2015 ; • Increase export volume to $1463.6 million dollars in 2015; • Life expectancy of the population in 2015 shall increase to 69.9 years; • The coverage of pre-school to post-school education shall increase to 95% in 2015; • Reduce the overall unemployment rate to 5.5% in 2015; • The shareof population with income below the minimum cost of living shall decrease to 8.1% in 2015; • Reduction in total emissions of air pollutants in 2015 by 5.5% compared to 2009. West Kazakhstan Region Development Program for 2011-2015