South Kazakhstan Region
140 likes | 337 Vues
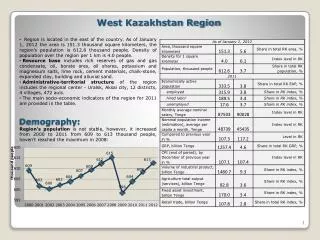
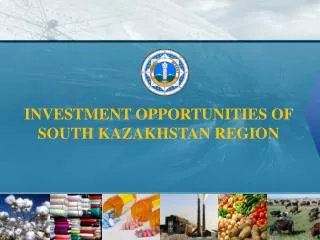
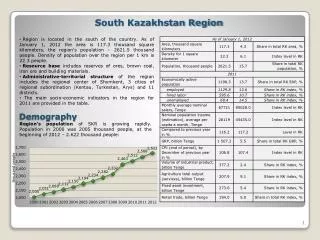
South Kazakhstan Region. Region is located in the south of the country . As of January 1, 2012 the area is 117 . 3 thousand square kilometers, the region's population – 2621 . 5 thousand people . Density of population over the region per 1 km is 22 . 3 people .

South Kazakhstan Region
E N D
Presentation Transcript
South Kazakhstan Region • Region is located in the south of the country. As of January 1, 2012 the area is 117.3 thousand square kilometers, the region's population – 2621.5 thousand people. Density of population over the region per 1 km is 22.3 people. • Resource base includes reserves ofores, brown coal, iron ore and building materials. • Administrative-territorial structure of the region includes the regional center of Shymkent, 3 cities of regional subordination (Kentau, Turkestan, Arys) and 11 districts. • The main socio-economic indicators in the region for 2011 are provided in the table. Demography Region’s population of SKRis growing rapidly. Population in 2000 was 2005 thousand people, at the beginning of 2012– 2.622 thousand people: 1
Economically active population (EAP) • The number of employed people increases and unemployed people falls in both absolute and relative terms.For 10 years, from 2001 to 2011, the employed population has increased from 88 to 94%, while the number of unemployed people has fallen from 12 to 6%. • Characteristic feature of the employed population dynamics is the growth of hired labor and the reduction of self-employed people.From 2001 to 2011 the number of hired labor has increased from 46% to 53%, the number of self-employed people has fallen from 54 to 47%: EAP of the region is increasing and in 2011 made up 1198.3 thousand people. 1129.8 thousand people of those are employed, 68.4 thousand people are unemployed. Economically inactive population made up 473.7 thousand people, it is higher than in 2000:
The changes of employed population structure is supported by a strong tendency of unemployment rate reduction from 14.3% in 2000 to 5.7% in 2011 and growth in economic activity of the population: • In 2011 unemployment rate of SKR was above the Kazakhstan’s average– 5.4%: Unemployment
Quality of Life • Cost of living has been growing steadily since 2003, but the values are below the average in RK : • Life expectancy at birth in the region is increasing, and dynamic values are above the average of RK in general: • Some of life quality indicators in 2011: • Share of population with income used for consumption below the poverty line decreases, however, it is above the average in RK:
Enrollment • Enrollment share of the population aged 6-24 years increased from 2001 to 2004. In 2011 the value is below the average in RK: • The number of children in regular preschools has increased significantly since 2001: • The number of students in technical and vocational education has increased, however, the decline in 2010 is contrary to the positive dynamics of the region's population: • The number of students in higher education was growing up to 2005, thereafter it started falling, despite the growth of the region’s population:
Monthly average nominal salary per employee for SKR in 2011 is 67,721 Tenge, it is below the national average – 90,028 Tenge: • In dynamics the average nominal salary per employee and the average nominal income per capita are ever-growing: • The index of the nominal and real incomes showed a decline during the economic crisis in 2009. At that time the growth of nominal income was lower than the consumer price index, i.e. revenue growth did not cover inflation: Population Income
GRP growth in 2011 is below the average growth of total GRP of all the regions of Kazakhstan and makes up 125.1% compared to 2010, against the total value of RK – 126.4%: • Despite GRP growth, SKR sharein total GRP of all the regions decreased from 6.9 % in 2000 to 5.5% in 2011: Economy
The growthof fixed asset investment in 2011 was below the total level of all RK regions,and made up 104% compared to previous year against 107.7% in RK in general: • Fixed assets investment tend to a stable significant growth, however, it showed a decrease in value during the crisis – in 2010 and 2011: • The share of fixed assets investment in the Kazakhstan’s investment increased from 2.5% in 2000 to 5.5% in 2011: Investment 8
The share of the region’s volume of production in agriculture in total Kazakhstan’s volume of industry’s production. In 2010 11.4% agricultural production of the country was produced in SKR : • The volume production in agriculture increased until 2010 to 163.8 billion Tenge: Agriculture 9
The growth of industrial production volumes was observed throughout the study period, excluding crisis year 2008, when manufacturing volumes showed the decrease: • Real sector industries with the highest volumes of production in 2010 weremetallurgical industry, agriculture, mining of metal ores, construction, machine industry, and etc.These industries have significant share of total production in the Republic of Kazakhstan: • The share of industrial production in the Kazakhstan’s level decreased from 5.5% in 2000 to 2.4% in 2011: Real Sector 10
Sector Enterprises • The number of industrial enterprises has been decreasing from 2000, however its share in RK’s level has increased : • The number of construction companies is increasing, and its share in RK’s level is decreasing: • The number of working agricultural enterprises and its share in RK’s level are growing:
SME • The number of registered legal entities as of October 1, 2012 equals 28362. The SME number is 28 164. The structure of the enterprises number is close to the RK average level: • SME share of the region's GRP isincreasing with a moderate pace, but it is below the RK’s average level:
Budget revenues of SKR region in 2011 amounted to 303.4 trillion Tenge, including 248.1 trillion Tenge of transfers from the national budget. Expenses amounted to 308.7 trillion Tenge, including 2.2 trillion Tenge of transfers to the national budget. Thus, the region issubventional. Interbudgetary Relations
Main target indicators : • Increase GRP by 2015 by31.1% in real terms compared to 2009; • Increase domestic and foreign investment in non-primary sectors of the economy in 2015 to 353.9 billion tenge; • Number of new enterprises in the SEZ "Ontustik" in 2015 – up to 10 units. • Keep inflation at the average of 5-8% a year: in 2011 -107.5, 2012 - 107.0, 2013 - 106.5, 2014 - 106.5, 2015 - 106.5; • Increase the share of export agricultural products and processed products by 2015 to 29%; • Reduce unemployment over the region by 2015 to 5.5% (2009 - 6.6%); • Increase the share of highly skilled workers of the working population in 2015 - up to 42.8% (2009 - 34.0%); • Increase pension system coverage of employees by 2015 to 73.3% (2009 - 69.0%); • Increase pension system coverage of self-employed population by 2015 to 7.2% (2009 - 0.33%); • Reduce the share of people with incomes below the poverty level by 2015 to 9.7%; • Reduce emissions by 2015 to 67.9 thousand tons South Kazakhstan Region Development Program for 2011-2015