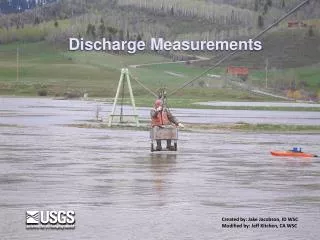
Discharge (Q)
Discharge (Q). Define (cfs; m 3 /s or “ cumecs ”) Why is Q Important? How is it measured?. What is the usefulness of Q?. Calculation of mass loading (L = Q*C) Stream power determination (Q & slope) Infer watershed hydrodynamics: Shape of storm event hydrograph Watershed characteristics.

Discharge (Q)
E N D
Presentation Transcript
Discharge (Q) Define (cfs; m3/s or “cumecs”) Why is Q Important? How is it measured?
What is the usefulness of Q? • Calculation of mass loading (L = Q*C) • Stream power determination (Q & slope) • Infer watershed hydrodynamics: • Shape of storm event hydrograph • Watershed characteristics. • Predominant water source of streams. • Interannual hydrograph • Flood frequency and magnitude • Changing conditions, e.g., land-use impacts. • Modeling and forecasting water resource needs.
Hydrographs • Plot of Q over time; • Peak(s) with a storm event.
Watershed Morphology • Longitudinal profile (changing slope) • Basin shape and timing of peak flow.
Downstream progression • Crotty Cr. = 1.2 km2 • Acheron R. = 619 km2 • Goulbon R. = 8601 km2
Water Supply • Groundwater supply in the Au Sable R. • Runoff supply in the Raisin R. • Note spring rain storms.
Why the change in baseflow? More People; more development; less infiltration = flashy watershed Urban stream Forested Stream Q Time after rain storm →
Urbanization Senaca Creek, MD Greater maximum discharge for storm events of similar frequency before and after urbanization.
Dam Impacts • Lower Missouri R. • Dammed in 1950s. • Variability reduced. • Q controlled for barges.
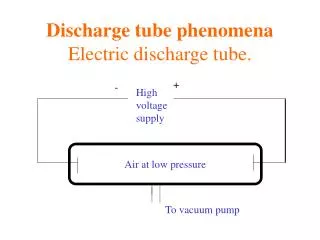
How is Q measured? • Direct Volumetric (L/s) • “V”-notch Weir • Dye Dilution • Velocity x Area • Stage to Discharge • Manning’s Equation
“V”=notch Weirs Calibrate artificial structure. Brakensiek Equation: Q = 1.342 H2.48
Dye Dilution Estimates of Q • Dye Slug vs Continuous Addition • Concentration of added dye is known. • Concentration is measured in stream over time.
Q = Area x Velocity • Measure height to cable per interval. • Note height to cable for “wet in” and “wet out”. • Measure velocity per interval. • Calculate Qi ; i.e. discharge per interval. • Q = Qi
Velocity Methods • Manually timed distance: • Near-neutrally buoyant floats • Dyes • Current meters: • Mechanical (propeller or cups) • Electromagnetic (our FlowMate) • Acoustic Doppler
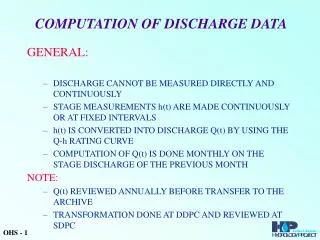
Continuous Monitoring of Q“The Q Rating Curve” • Water height (Stage) vs Q relationship. • Stage determined by staff plate. • Stage by float mechanism. • Stage by pressure gauge: • Incorporated in a water quality Sonde • Requires correction for or venting for barometric pressure changes.
Manning’s Equation Q = 1/n AR2/3 S1/2 • A = cross-section area • S = longitudinal slope of channel • n = Manning’s n (bottom friction constant)