Download
1 / 33
330 likes | 472 Vues
Neuroeconomic models of PG: Risk preference and delay discounting. Kate Lomakina 9 November 2012 . Outline. Risk aversion Expected value vs. expected utility theory R isk - taking models Risk perception I ndividual risk attitudes Delay discounting

E N D
Neuroeconomic models of PG:Risk preference and delay discounting Kate Lomakina 9 November 2012
Outline • Risk aversion • Expected value vs. expected utility theory • Risk-taking models • Risk perception • Individual risk attitudes • Delay discounting • Delay discounting in pathological gambling
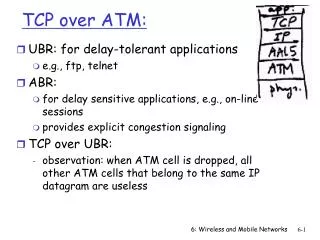
Expected value theory • In midof XVII century people were believed to maximize the expected (monetary) value of the gamble – the expected value theory • However it was rejected due to the so-called St Petersburg paradox. • Assume that casino offers you a following game of chance: the croupier flips the coin until the first time tail appears and pay you back 2#of heads. • How much are you willing to pay to enter this game? • What is the fair price of the game?
Expected utility theory • “The determination of the value of an item must not be based on the price, but rather on the utility it yields…. There is no doubt that a gain of one thousand ducats is more significant to the pauper than to a rich man though both gain the same amount”, D. Bernoulli • Saying this he has proposed expected utility theory where u(x) is some concave utility function which somehow disassociate wealth and money.
Expected utility theory • Assume that utility function is a power functionthen parameter can serve as individual’s degree of risk aversion. • > 1 can signal risk-seeking behavior, when < 1 is a sign of risk—aversive behavior. • According to Von Neumann–Morgenstern utility theorem under certain axioms we can prove that there utility function can be uniquely determined given a set of simple lotteries.
Risk aversion model • On the basis of Expected Utility model two measures of risk aversion were proposed by Arrow & Pratt (1964) • The Arrow-Pratt absolute risk aversion measure: • The Arrow-Pratt relative risk aversion measure:
Relative risk attitude • The Arrow-Pratt measure was later replaced by relative risk attitude (Dyer & Sarin, 1982) measure which accounts for the domain different decrease in marginal value v(x) (the difference between two houses and one house is different than between one saved life and two). • Unfortunately, comparison of these measures to behavioral studies showed that they can predict real behavior in a small number of cases (Keller, 1985).
Risk return model • Another way to resolve St Petersburg paradox is a risk-return model where willingness to pay (WTP) is a tradeoff between the options’s return V(X) and a its risk R(X) with the assumption that people will try to minimize level of risk for a given level of return: • Parameter b can serve as an individual difference index of risk aversion.
Risk return model • This risk–return tradeoff model is widely used in finance, e.g., in the Capital Asset Pricing Model (CAPM; Sharpe, 1964; Bodie&Merton, 1999), and can be seen as a quadratic approximation to a power or exponential utility function. • However experimental evidence as well as choice patterns observed in the real world suggests that individuals often do not behave in a manner consistent with either of expected utility or risk-return model (McFadden, 1999; Camerer, 2000).
Uncertainty • There are two types of uncertainty: • Aleatoryuncertainty, i.e., objective and irreducible uncertainty about future occurrences that is due to inherent stochasticityin physical or biological systems (the outcome of the coin flip) • Epistemic uncertainty, which is subjective and reducible, because it results from a lack of knowledge about the quantities or processes identified within a system (the probability of the disease). • Learning from description allows to minimize epistemic uncertainty • Learning from experience minimizes aleatory uncertainty.
Risk and Uncertainty • It is important to distinguish between Risk and Uncertainty. • Risk – I know how likely is that I will fail but I still want to try. • Uncertainty– I have no idea how dangerous it is. • It was shown (Ellsberg, 1961) that people clearly distinguish between these risky and uncertain options and clearly prefer former ones.
Risk perception • Studies of financial decisions typically find that the EV of risky investment options presented in decisions from description is a good approximation of expected returns (Weber et al., 2005) • However our estimation of the uncertainty also has its limits. Survey data assessed in populations known to differ in actual risk-taking behavior suggest that risk-takers judge the expected benefits of risky choice options to be higher than do control groups (Hanoch et al., 2006).
Variance perception • Observed variance or standard deviation of outcomes also fails to account for perceived risk, for a variety of reasons: • Perceptions of riskiness tend to be affected far more by downside variation contraty to the mathematically defined variance (e.g., Luce and Weber, 1986). • Variability in outcomes is perceived relative to average returns • The coefficient of variation (CV) provides a relative measure of risk, i.e., risk per unit of return.
Coefficient of variation • Coefficient of variation (CV) is used in many applied domains, and provides a vastly superior fit to the risk-taking data of foraging animals and people who make decisions from experience (Weber et al., 2004). • Weber et al. (2004) also show that simple reinforcement learning models that describe choices in such learning environments predict behavior that is proportional to the CV and not the variance.
Neuroimaging • Neuroimaging studies suggest that there is strong path dependence in the brain’s reaction to economic quantities like likelihood or risk/variance. • Manipulations on probabilities of different outcomes or their magnitudes (or both), results different patterns of activation when looking at the effect of EV and variance on risk-taking Contrary to finance models of risk-taking (Preuschoffet al., 2006 vsFigner et al., 2007). • Different patterns of brain activation were found in studies examining loss aversion depending on whether each decision is resolved or not (Tom et al., 2007 vsHuettelet al., 2006), or whether people make decisions or just contemplate the options (Breiteret al., 2001).
Individual risk attitude • Risk-taking is far from stable across situations for most individuals (Bromiley & Curley, 1992). • There is no single measure of “risk attitude” that can be inferred from observed levels of risk-taking. • The same person often shows different degrees of risk-taking in financial, career, health and safety, ethical, recreational, and social decisions (MacCrimmon & Wehrung, 1986; Weber et al., 2002;Hanochet al., 2006). This leaves two options: • There is no stable individual difference in people’s attitude towards risk. • We still need to find a way to measure risk attitude in a way that shows stability across domains.
How to measure risk attitude • Purpose specific. Prediction and intervention problems require very different levels of deepness. • Domain specific. Assessed risk-taking for monetary gambling worked far worse to predict real-world investment decisions than assessed risk-taking for investment (Weber et al., 2004)
Delay discounting • Delay discounting is the tendency for motivation recruited by expected events to be inversely related to their delay. • Indifference point is a point where values discounted by there delay become equal: 45$ now or 100$ in a year time. • Delay discounting allows to model conflicting values in case of addiction: one cigarette now vs. healthy lungs in twenty years.
“beta-delta” model • There are rational reasons to the delay discounting such as opportunity costs. According to them there is a constant discount rate which exponentially decrease the value with time. • However lab results show that people rate differently difference between “now” and “in one day” and difference between 99 and 100 days. One simple model makes “now” special by introducing a parameter β < 1. This model sometimes refers as “beta-delta” model.
Hyperbolic model • Another simple model assumes hyperbolic discount with a single parameter:
Neuroimaging findings • In a study by McClure et al. (2004) the hypothesis was made that “beta” part of “beta-delta” model is mediated by limbic structures and “delta” by the lateral prefrontal cortex and associated structures supporting higher cognitive functions. • Their neuroimaging findings support their hypothesis showing higher limbic/paralimbic structures activity when the immediate reward was present and also when chosen. “delta” network “beta” network
Neuroimaging findings • There are some consistent evidences that lateral prefrontal cortex during decision-making biases toward later but larger alternatives (Weber & Huettel, 2008; Lue et al., 2011; Christakou et al., 2011; Cho et al., 2010; Figner et al., 2010). • However the function of “beta” network was criticized. It was shown by that “beta” network was not differentially sensitive to immediacy but rather tracked overall value (Kable & Glimcher, 2007). • This disagreement with initial theory was consistent with other studies (Weber & Huettel, 2008; Lue et al., 2011; Wittmann et al, 2007);
Delay discounting and addictions • It is one source of systematic irrationality that has been most conclusively linked to addiction. • There are many reports that drug addicts and pathological gamblers discount steeper. • However the causality is not obvious, whether it is addiction which affects discounting or steeper discounting imposes high risk of addiction. • Perhaps, the steeper discounting in drug addicts can be explained by relative weakness of the “delta” network. Which can also lead to weakening of prefrontal inhibitory modulation of the limbic system which is known to be associated with chronic drug use.
Delay discounting in PG • In the study by Petry (2001) the additive effect of pathological gambling and substance addictions was demonstrated. • He compared three groups of subjects: non-substance-abusing pathological gamblers, substance-abusing pathological gamblers and controls. Controls were matched to the gamblers. • Subjects from all three groups performed set of decisions to choose between certain value now or 1000$ after a delay. Rewards varied across 1$ and 999$ and delays across 6hrs and 25 years.
Delay discounting in PG • Under the hyperbolic delay discounting model he has discovered significant difference not only between healthy controls and pathological gamblers but also between substance addicted and non-addicted pathological gamblers. • The values of the steepness parameter K were 0.02 (0.00-0.11) for control group )open triangles), 0.06 (0.02-0.22) for non-substance abusing PG (open squares) and 0.29 (0.05-1.93) for substance-abusing PG (open diamonds).
Delay discounting in PG • The difference between non-substance abusing and substance-abusing gamblers was not only in the steepness of the discounting rate but also in cigarette and alcohol consumption and SOGS score. • Also the significant correlation between K and number of days gambled in last 90 days was observed. • However the causality between excessive behavior and delay discounting is not clear at all. Some data have suggested that abstinent smokers and alcoholics and drug users have reduced discounting rates compared with active users.
Delay discounting in PG – additive effect • The additive effect of two types of addictions is supported by the previous study which has shown that “pure” substance-abusers show nearly the same steepness (K = 0,05) of the delay discounting as “pure” PG (K=0,06). • Some studies using personality questionnaires have also shown that substance abusers with gambling problems scored higher than “pure” substance abusers on impulsivity personality inventories. • In PCA analysis of a behavioral study by Petry (2001) three distinctive components have emerged: impulsivity, sensation seeking and time orientation. The presence of PG and substance abuse together had additive effects on impulsivity and time orientation but not sensation seeking.
Delay discounting in PG – impulsivity • The results lend some credit to the classification of PG and substance use disorders as problems of impulse control. However compulsivity component of the addictions was not the focus of the study. • The overlap in cross addictions and family history also supports the common nature of these two types of disease and manifestation of the particular form may depend on social acceptability or accessibility of drug use or gambling.
Delay discounting in PG – Preference reversals • Delay discounting may serve as a method for quantifying individual differences related to the preference reversals phenomena. • When both casino and mortgage default are far in time user would rationally give the higher priority to the interest rate payment however when already in casino the immediate gambling reward can outweigh and change the preferences. • Rational delay discounting could not model this.
Delay discounting in PG – wins and losses discounting • A wide literature demonstrates that small rewards are discounted more rapidly than large ones (Kirby et al, 1999; Myerson & Green, 1995). In gambling, say, 1$ bet will loose half of its subjective value in a matter of minutes, whereas a $1000 win will not loose half of its value for 1 year or more. • It was suggested (Rachilin, 1990) that gambler bet in “strings” in which subjective losses are not considered until the next win occurs. And the cumulative effect of every “string” is greatly devaluated due to the rapid discounting of relatively small bets. • There are inconsistent findings on whether losses are discounted more rapidly than wins. However it was shown that both substance abusers and PG are relatively insensitive to delayed losses (Petry et al., 1998; Petry, 2001).
Conclusions • Risk aversion is highly unstable among individuals also as within one individual’s behavior. • Risk and variance perception can also be unstable and thus unpredictable. • No reliable risk aversion measure is proposed so far. • Delay discounting seems to reliably capture the impulsivity component of pathological gambling. • Different types of addictions seem to have an additive effect on the impulsiveness.