Download
1 / 17
170 likes | 257 Vues
Dive into flood events in Flathead County and Kalispell, MT, exploring Geo-HMS and HEC-HMS processes, motivations, catchment delineation, soil data characterization, and model calibration. Gain insights on peak flows, project coordination, and future work.

E N D
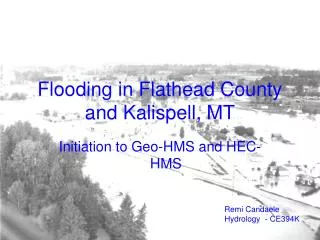
Flooding in Flathead County and Kalispell, MT Initiation to Geo-HMS and HEC-HMS Remi Candaele Hydrology - CE394K
Outline • Context & Flood Events Characteristics • ArcGIS Process • Geo-HMS Process • HMS Model • Future Work Evergreen – Kalispell Suburb - 1995
Context • Flathead county subject to flooding • Located in northwest corner of Montana State. • Total area of 13,614 km² (5,256 mi²), • 410 km² (158 mi²) of it (3.01%) is water. • As of 2000, the population was 74,471.
Motivations • Being familiar with a Hydraulic Model !!!
Flood Events Characteristics Peak Flow : 2 events at 35m3/s Peak Flow : 2 events > 100m3/s
Flood Events Characteristics Flathead Valley • Occurring mostly during spring time, • Focus on 2 major events : • 04/13/1996 • 04/20/1997 • Low Rainfall intensity : computation over a long period, • Difficulty : 1 meteorological station and 2 gauge stations. Time Series
Catchments & Streams Delineation • Projected Coordinate System : NAD1983_StatePlane_Montana • 7 Subwatersheds selected SubWatershed Characteristics
Reclassification of Land Cover • Data downloaded from NLCD • Reclassification in 4 main categories thanks to Dr Venkatesh Merwade Land Use Grid Obtained
Soil Data – Characterization of the Soil Type • SSURGO (scale 1:24,000) dataset doesn’t cover the entire watershed: use of the Statsgo dataset (1:250000). • 4 types of soil: A/B/C/D. Soil B assigned to the unknown soils
Curve Number & Grid • CN obtained from SCS TR55 (1986) • Generation of a CN Grid • Statistics • Mean : 66.26 • Std Deviation : 11.06
Geo-HMS ArcGIS Interface to create input files to HMS • Processes • River Length • River Slope • Basin Slope • FlowPaths, • Basin Centroids • HMS Inputs/Parameters • Loss, Transform methods by SCS, • Route method by Muskingum • Time Lag • Basin Curve Numbers Selection of the contributing catchments - GeoHMS Interface
Geo-HMS ArcGIS Interface to create input files to HMS Basin Lag in Hours Basin Curve Numbers
Geo-HMS ArcGIS Interface to create input files to HMS Schematic Export to HMS
Running the model under HMS • Meteorologic model : • Weight gages, • Muskingum routing, • Time Lag, • Time Series.
Results – Calibrating the model • Computations for exercising. • Next steps : • Find accurate numbers for Muskingum routing, • Calibration factor : Streamflow = Model
Acknowledgments • Venkatesh Merwade – Purdue U. • Christine Dartiguenave – ESRI • Ron Schlagenhaufer – Flathead County • Folks : Eusebio, Tyler, Brian & others