Download
1 / 16
160 likes | 359 Vues
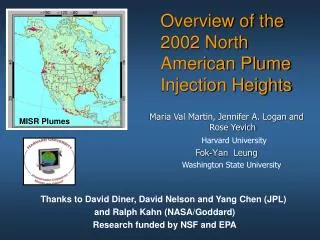
Overview of the 2002 North American Plume Injection Heights. Maria Val Martin, Jennifer A. Logan and Rose Yevich Harvard University Fok -Yan Leung Washington State University. MISR Plumes. Thanks to David Diner, David Nelson and Yang Chen (JPL) and Ralph Kahn (NASA/Goddard)

E N D
Overview of the 2002 North American Plume Injection Heights Maria Val Martin, Jennifer A. Logan and Rose Yevich Harvard University Fok-Yan Leung Washington State University MISR Plumes Thanks to David Diner, David Nelson and Yang Chen (JPL) and Ralph Kahn (NASA/Goddard) Research funded by NSF and EPA
Large area burned over North America in 2002 • “2002 fire season was one of the biggest of the past half century”, Ecology and Economic Research Department • 3,000,000 ha burned in U.S. and 2,500,000 ha in Canada • 1 billion $ to suppress fires in the lower 48 states NASA/Goddard Space Flight Center MODIS Rapid Response Project (NASA/GSFC and University of Maryland)
Hayman fire caused worst air quality ever in Denver The Hayman fire, Colorado • 56000 ha, June 8-22, 2002 • 30 miles from Denver and Colorado Springs June 8, 2002 June 9, 2002 PM10 = 40 μg/m3 PM2.5 = 10 μg/m3 PM10 = 372 μg/m3 PM2.5 = 200 μg/m3 Colorado Department of Public Health and Environment Vedal et al., Env Res, 2006
Boreal Wildfires Boreal wildfire emissions perturb hemispheric CO Average Northern Hemisphere CO from NOAA/GMD stations Annual running average Kasischke et al., JGR 2005
Increasing area burned and frequency of fires Area burned in Canada has increased since the 1960s 5 year means Gillett et al., GRL, 2004 Increased fire frequency over western U.S. since last decades Westerling et al., Science, 2007
Objectives and Approach • Obtain better estimates of injection heights from forest fires • Use of MISR data to determine the dependence of plume height on meteorology, area burned and fuel characteristics Assess the effects on atmospheric composition • Use CTM GEOS-Chem to examine the regional influences of fires on trace gases and aerosols and hemispheric scale effects McNally Fire (CA)
Potential Temperature Vertical Gradient • Meteorology • GEOS-4 2x2.5 resolution • PBL, pressures and temperature interpolated to MISR overpass time PBL Relationship between atmospheric stability and observed plume heights [Kahn et al., 2007] Objectives and Approach • 2002 North American Plumes • 488 plumes digitalized with MINX v1.0 • 340 plumes analyzed • February--November 2002 • 56% located in AK and Can, 36% in lower 48 states and 8% in Mexico and Puerto Rico
Quebec fires 250,000 Ha July 2-10, 2002 Median Height = 1103 m km Stratified profile Plume trapped at stable layer PBL Number of Pixels m Plume Heights and Height of PBL MISRwind-corrected median heights
Plume Heights and Height of PBL Hayman Fire (CO) 56,000 ha June 8-10 & June 17-18 40% burned with high severity Colorado Department of Public Health and Environment Median Height=4156 m km Weak stratified profile Plume trapped at stable layer PBL Number of Pixels
Plume Heights and Height of PBL Rodeo Fire (AZ) 104,000 Ha June 18-July 7 http://www.gsfc.nasa.gov/topstory/20020701fires.html Median Height = 3997 m Neutral profile Plume dispersed vertically PBL
km km Plume Heights and Height of PBL BJ Bay Comp (GA) 49, 600 ha Median Height = 1133m Stratified profile Plume trapped below PBL Moose Creek (AK) 2,100 ha Median Height = 968 m Stratified profile Plume trapped below PBL
peak-=-0.125 km 2004 2002 Median Heights peak-=-0.125 km Heights Normalized by Total Pixel Count Boreal wildfire smoke injection heights in 2002 similar behavior as 2004… 2002 193 -0.125 24-30% 6-9% Plume Heights and Height of PBL 5-17% plumes injected above PBL in 2004 over AK and Can Kahn et al, GRL, in press
Plume Heights and Height of PBL Injection heights over the lower 48 states and Mexico/Puerto Rico AK and Can
Larger fraction of plumes above PBL in lower 48 states and subtropical fires Plume Heights and Height of PBL Injection heights over the lower 48 states and Mexico/Puerto Rico AK and Can Lower 48 Subtropical
Poor correlation between injection heights and fuel loading Rodeo Fire (AZ) and Hayman Fire (CO) Kg dry matter/m2 Plume Heights and Fuel Consumption Fuel Loading Map (0.025x0.025 resolution) and Plume Median Heights
Summary • MISR was able to detect plumes with different fire characteristics (stability, severity, and fuel loading) • The 2002 North American plumes show that about 6-20% fire plumes reach the FT • Higher fraction of plumes found above boundary layer for the lower 48 states and subtropical region • Poor correlation between injection height and fuel consumption for the lower 48 states fires, perhaps atmospheric stability is more important • On-going work: • Parameterization of injection heights of emissions from forest fires in GEOS-Chem