Download
1 / 50
500 likes | 738 Vues
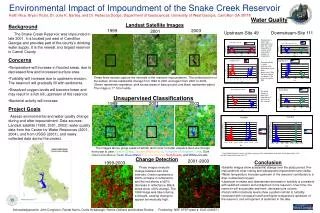
Hypothesis-Test-Based Landcover Change Detection Using Multitemporal Satellite Images. S. P. Teng, J. L. Chiang, Y. K. Chen, K. S. Cheng Lab for Remote Sensing Hydrology and Spatial Modeling Dept. of Bioenvironmental Systems Engineering National Taiwan University. Change Detection.

E N D
Hypothesis-Test-Based Landcover Change Detection Using Multitemporal Satellite Images S. P. Teng, J. L. Chiang, Y. K. Chen, K. S. Cheng Lab for Remote Sensing Hydrology and Spatial Modeling Dept. of Bioenvironmental Systems Engineering National Taiwan University 36th COSPAR Scientific Assembly 2006 Beijing July 20, 2006
Change Detection • Change detection is the process of identifying differences in the state of an object or phenomenon by observing it at different times. • In general, change detection involves the application of multi-temporal datasets to quantitatively analyze the temporal effects of the phenomenon. • Because of the advantages of repetitive data acquisition, its synoptic view, and digital format suitable for computer processing, remotely sensed data have become the major data sources for different change detection applications during the past decades. 36th COSPAR Scientific Assembly Beijing, 2006 Dept. of Bioenv. Syst. Eng., National Taiwan University
Major Methods of Change Detection • Post-classification methods • Image-differencing methods • Principal component analysis methods 36th COSPAR Scientific Assembly Beijing, 2006 Dept. of Bioenv. Syst. Eng., National Taiwan University
Image Differencing Method for Change Detection • The process basically calculates grey level difference between two images and adopts a threshold value of grey level difference for land-cover change detection. • Image differencing on single band or composite images is the most widely used approach of change detection. 36th COSPAR Scientific Assembly Beijing, 2006 Dept. of Bioenv. Syst. Eng., National Taiwan University
Problems and challenges • How should the threshold value be determined? • How much confidence do we have on decision of change detection? 36th COSPAR Scientific Assembly Beijing, 2006 Dept. of Bioenv. Syst. Eng., National Taiwan University
Determining Threshold for Change Detection Multiples of standard deviation of DN difference Nelson (1983): k = 0.5~1 Ridd and Liu (1998): k = 0.9~1.4 Sohl (1999): k = 2 36th COSPAR Scientific Assembly Beijing, 2006 Dept. of Bioenv. Syst. Eng., National Taiwan University
It uses grey level differences of all pixels (including changed and no-change pixels) to determine the threshold. • It does not consider the grey level correlation of multi-temporal images. • Generally speaking, pre- and post-period images of the same spectral band are highly correlated (since changes are rare). 36th COSPAR Scientific Assembly Beijing, 2006 Dept. of Bioenv. Syst. Eng., National Taiwan University
Bivariate Scatter Plot of Multi-temporal Images Red band 01/10/1999 vs 21/09/2002 36th COSPAR Scientific Assembly Beijing, 2006 Dept. of Bioenv. Syst. Eng., National Taiwan University
36th COSPAR Scientific Assembly Beijing, 2006 Dept. of Bioenv. Syst. Eng., National Taiwan University
36th COSPAR Scientific Assembly Beijing, 2006 Dept. of Bioenv. Syst. Eng., National Taiwan University
36th COSPAR Scientific Assembly Beijing, 2006 Dept. of Bioenv. Syst. Eng., National Taiwan University
36th COSPAR Scientific Assembly Beijing, 2006 Dept. of Bioenv. Syst. Eng., National Taiwan University
Change Detection Using BivariateProbability Contours 95% probability contour X2 90% probability contour X1 : detected changes 36th COSPAR Scientific Assembly Beijing, 2006 Dept. of Bioenv. Syst. Eng., National Taiwan University
Disadvantage of Using the Bivariate Probability Confidence Interval • Thresholding of the grey level difference is globally based, i.e., all no-change pixels are considered. It fails to consider the effect of the pre-period grey level on the grey level of the post-period. • It is important to examine the conditional probability distribution on the bivariate scatter plot of multi-temporal images. 36th COSPAR Scientific Assembly Beijing, 2006 Dept. of Bioenv. Syst. Eng., National Taiwan University
Conditional Prob. Distribution Joint Prob. Distribution Bivariate Joint Probability Distribution and Conditional Probability Distribution (post-period DN) X2 X1 (pre-period DN) 36th COSPAR Scientific Assembly Beijing, 2006 Dept. of Bioenv. Syst. Eng., National Taiwan University
Class-dependent Temporal Correlation X2 X1 36th COSPAR Scientific Assembly Beijing, 2006 Dept. of Bioenv. Syst. Eng., National Taiwan University
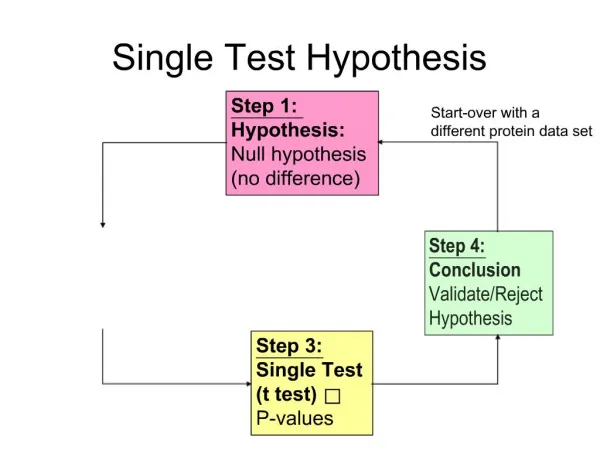
Statistical Aspects of Change Detection • Uncertainties involved • A statistical test requires • The null and alternative hypotheses • A test statistic • Level of significance 36th COSPAR Scientific Assembly Beijing, 2006 Dept. of Bioenv. Syst. Eng., National Taiwan University
Transforming Change Detection to Hypothesis Test • Using conditional probability distribution the work of change detection can be placed in the framework of a hypothesis test. • Null hypothesis Ho: no change (Therefore, no-change pixels of individual classes are needed.) • Test statistic? 36th COSPAR Scientific Assembly Beijing, 2006 Dept. of Bioenv. Syst. Eng., National Taiwan University
Bivariate Normal Distribution • Conditional normal distribution Parameters can be estimated using pixels associated with no change. Critical regions with respect to the chosen level of significance can then be determined. 36th COSPAR Scientific Assembly Beijing, 2006 Dept. of Bioenv. Syst. Eng., National Taiwan University
Steps to Establish CI Using Conditional PDF • Identifying no-change pixels • LULC classification for major features (soil, vegetation and water) for pre- and post-period images respectively. • Class-specific correlation analysis using only no-change pixel pairs • Determining bivariate probability distribution for each class • Determining the class-specific conditional PDF • Specifying class-specific critical regions for test at level of significance 36th COSPAR Scientific Assembly Beijing, 2006 Dept. of Bioenv. Syst. Eng., National Taiwan University
Comparison of Confidence Intervals Established by Bivariate Joint Distribution and Conditional Distribution 36th COSPAR Scientific Assembly Beijing, 2006 Dept. of Bioenv. Syst. Eng., National Taiwan University
Study Area and Data • The Chi-Jia-Wan Creek watershed (Area-A, 71 km2) and the an area (Area-B, 250 km2) down-stream of the Te-Chi Reservoir in central Taiwan. • Multispectral SPOT-5 images and 1/5000 airphotos were used. Area-A Area-B 36th COSPAR Scientific Assembly Beijing, 2006 Dept. of Bioenv. Syst. Eng., National Taiwan University
Pre-period SPOT image 21/07/’04 Area-A Post-period SPOT image 09/07/’05 36th COSPAR Scientific Assembly Beijing, 2006 Dept. of Bioenv. Syst. Eng., National Taiwan University
Area-B 36th COSPAR Scientific Assembly Beijing, 2006 Dept. of Bioenv. Syst. Eng., National Taiwan University
Pre-period SPOT image (26/06/’04) Area-B Post-period SPOT image (12/07/’04) 36th COSPAR Scientific Assembly Beijing, 2006 Dept. of Bioenv. Syst. Eng., National Taiwan University
Confusion matrix – pre-period image (Area-B) Confusion matrix – post-period image (Area-B) 36th COSPAR Scientific Assembly Beijing, 2006 Dept. of Bioenv. Syst. Eng., National Taiwan University
Establishing the Bivariate Joint Distribution Change detection using single-feature images. versus Change detection using multiple-feature images (e.g., NDVI, principal components, etc.). Does normality hold for the selected feature? 36th COSPAR Scientific Assembly Beijing, 2006 Dept. of Bioenv. Syst. Eng., National Taiwan University
Grey Level Histogram IR R G water vegetation soil 36th COSPAR Scientific Assembly Beijing, 2006 Dept. of Bioenv. Syst. Eng., National Taiwan University
IR R G water vegetation soil 36th COSPAR Scientific Assembly Beijing, 2006 Dept. of Bioenv. Syst. Eng., National Taiwan University
Finding the Test Statistic (1/7) • Single-feature change detection 36th COSPAR Scientific Assembly Beijing, 2006 Dept. of Bioenv. Syst. Eng., National Taiwan University
Finding the Test Statistic (2/7) • Multiple-feature change detection 36th COSPAR Scientific Assembly Beijing, 2006 Dept. of Bioenv. Syst. Eng., National Taiwan University
Finding the Test Statistic (3/7) 36th COSPAR Scientific Assembly Beijing, 2006 Dept. of Bioenv. Syst. Eng., National Taiwan University
Finding the Test Statistic (4/7) It does not yield a conditional distribution for change detection. 36th COSPAR Scientific Assembly Beijing, 2006 Dept. of Bioenv. Syst. Eng., National Taiwan University
Finding the Test Statistic (5/7) 36th COSPAR Scientific Assembly Beijing, 2006 Dept. of Bioenv. Syst. Eng., National Taiwan University
Finding the Test Statistic (6/7) • Multiple-feature BVN change detection 36th COSPAR Scientific Assembly Beijing, 2006 Dept. of Bioenv. Syst. Eng., National Taiwan University
Finding the Test Statistic (7/7) Bivariate Normal Distribution for any constant c = Covariance matrix 36th COSPAR Scientific Assembly Beijing, 2006 Dept. of Bioenv. Syst. Eng., National Taiwan University
Area-A 36th COSPAR Scientific Assembly Beijing, 2006 Dept. of Bioenv. Syst. Eng., National Taiwan University
(PC1, PC1) BVN Vegetation 36th COSPAR Scientific Assembly Beijing, 2006 Dept. of Bioenv. Syst. Eng., National Taiwan University
(PC1, PC1) BVN Water 36th COSPAR Scientific Assembly Beijing, 2006 Dept. of Bioenv. Syst. Eng., National Taiwan University
(PC1, PC1) BVN Bare Land 36th COSPAR Scientific Assembly Beijing, 2006 Dept. of Bioenv. Syst. Eng., National Taiwan University
Detected ChangesArea-A α=1% α=10% α=5% 36th COSPAR Scientific Assembly Beijing, 2006 Dept. of Bioenv. Syst. Eng., National Taiwan University
36th COSPAR Scientific Assembly Beijing, 2006 Dept. of Bioenv. Syst. Eng., National Taiwan University
36th COSPAR Scientific Assembly Beijing, 2006 Dept. of Bioenv. Syst. Eng., National Taiwan University
Area-B 36th COSPAR Scientific Assembly Beijing, 2006 Dept. of Bioenv. Syst. Eng., National Taiwan University
Validation • Through field investigation and using high resolution airphotos a set of validation data including both changed and no-change pixels were carefully selected. • Confusion matrices were established for performance evaluation of the proposed approach. 36th COSPAR Scientific Assembly Beijing, 2006 Dept. of Bioenv. Syst. Eng., National Taiwan University
Area-A 36th COSPAR Scientific Assembly Beijing, 2006 Dept. of Bioenv. Syst. Eng., National Taiwan University
Area-B 36th COSPAR Scientific Assembly Beijing, 2006 Dept. of Bioenv. Syst. Eng., National Taiwan University
Overall Accuracy vs Level of Significance Area-A Area-B 36th COSPAR Scientific Assembly Beijing, 2006 Dept. of Bioenv. Syst. Eng., National Taiwan University
Summary • We have demonstrated that change detection can be placed in a hypothesis test framework. • By using the conditional distribution high accuracy of change detection can be achieved. 36th COSPAR Scientific Assembly Beijing, 2006 Dept. of Bioenv. Syst. Eng., National Taiwan University
Thanks for your attention. 36th COSPAR Scientific Assembly Beijing, 2006 Dept. of Bioenv. Syst. Eng., National Taiwan University