School Store Survey
School Store Survey. By: Max Eckelman Period 3. Introduction. These are the results from the survey Marketing students from period 3 designed and distributed. They offer a large variety of information to help answer questions about opening a new student store.

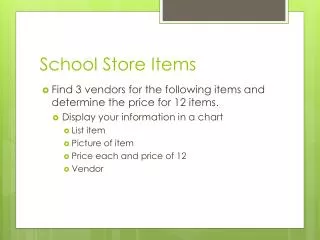
School Store Survey
E N D
Presentation Transcript
School Store Survey By: Max Eckelman Period 3
Introduction • These are the results from the survey Marketing students from period 3 designed and distributed. • They offer a large variety of information to help answer questions about opening a new student store. • Survey was conducted October 2006 at DDHS. • A copy of the survey instrument will be provided.
Age Group • We surveyed mostly freshmen. • All classes were evenly represented. • Included some staff members. • 84 total respondents
Store Location • Most preferred the north building. • There was 87 total responses.
Store Hours • Most preferred lunch time as store hours. • There were 80 total respondents
Preferred Food Groups • Most preferred the lunch time food options. • All foods options were evenly represented. • There were 163 total respondents
Preferred Beverage Groups • Water choices and carbonated beverages were mostly preferred. • There were 159 total respondents.
How Much a Consumer Would Spend • Most would spend $2.01 to $4.00. • There were 89 total respondents. • Most wouldn’t spend more than $6.
Preferred Items • Most would prefer foods and snacks. • There were 91 total respondents.
Average Purchasing • Most would occasionally buy supplies. • There were 81 total respondents. • There was a fairly even representation. • Twice as many would buy supplies.
Average Visitations • Most said they would visit weekly. • There were 85 total respondents.
Recommendations • Student store is to be held during lunch. • Serve lunch foods and beverages. • Locate in North building. • Carry limited line of supplies.
However, • Lunch is a very difficult option for BAM. • A second survey could further study breakfast options.