HCAL Operational Status and PMT Rate Effects Analysis Post Technical Stop
The HCAL operation has resumed since the last technical stop without any dead cells reported. We have integrated a luminosity of 480.5 pb-1. As expected, transmission effects are observed, necessitating gain corrections averaging -2% on the LED response of 56 very central cells re-evaluated four times. The L0Hadron rate varies within fills, primarily as a result of PMT rate effects, with ongoing stability assessments indicating resilience but also highlighting the need for potential PMT replacements or adjustments. Data comparisons with ECAL reveal a similar rate effect distribution.

HCAL Operational Status and PMT Rate Effects Analysis Post Technical Stop
E N D
Presentation Transcript
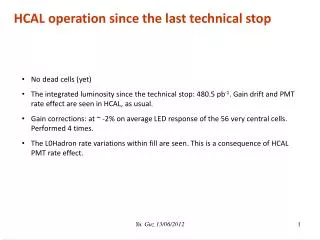
HCAL operation since the last technical stop • No dead cells (yet) • The integrated luminosity since the technical stop: 480.5 pb-1. Gain drift and PMT rate effect are seen in HCAL, as usual. • Gain corrections: at ~ -2% on average LED response of the 56 very central cells. Performed 4 times. • The L0Hadron rate variations within fill are seen. This is a consequence of HCAL PMT rate effect. Yu. Guz 13/06/2012
HCAL HV correction The reference LED amplitudes were chosen from the first high luminosity fill after the technical stop. The amplitudes used for correction, as well as the reference, were chosen taking into account the PMT rate effect: 1-2 h after the beginning of the fill,to let the PMT gain stabilize. For the period between April and June technical stops, we use as a reference the saveset in fill 2583, CaloDAQCalib-114322-20120503T020756.root The moment of change was determined from the average LED amplitude over 56 very central counters (10 ≤ ix ≤ 21, 13 ≤ iy ≤ 18) which contribute the most into the hadron trigger rate (shown by rectangle at the figure below). The threshold was arbitrarily set to 2-3% drop w.r.t. reference. Yu. Guz 13/06/2012
HCAL HV correction HV corrections sum/sumref, 56 central cells -2% TS, source calibration reference four HV corrections since the technical stop:14-May, 23-May, 03-Jun, 12-Jun the procedure works correctly Yu. Guz 13/06/2012
L0hadron / L0muon 2012 In general, L0Hadron is reasonably stable. Yu. Guz 13/06/2012
L0Hadron stability (Richard) HCAL PMT heat up effect?: 2h however, HCAL PMT rate effect leads to instability within fill Yu. Guz 13/06/2012
HCAL HV update-II : L0Had / L0Mu (Regis Lefevre) http://lblogbook.cern.ch/L0+Trigger/1411 Also seen by Regis before
HCAL rate effect 2012 (May 14-23) >5%: 188 PMTs >10%: 56 PMTs The rate effect is present in the high luminosity data in many PMTs: 188 have >5%. The nastiest case is when the rate effect is slow (one of such is unfortunately in the centre, I_18_15). slow fast Yu. Guz 13/06/2012
HCAL rate effect 2012 (May 14-23) vs 2011 The magnitude of rate effect in the “bad” PMTs in 2012 is basically the same as (or even somewhat higher than) in 2011 (07-Sep – 05-Oct) (in spite of 2 times lower gain). The PMTs looking improved are in fact those which were replaced during the shutdown (45 PMTs) or had contacts in signal path repaired (3 PMTs). No new “bad” PMTs appeared. It looks like the rate effect is an intrinsic feature of a PMT: HCAL has ~200 “special” unstable ones. replaced in 2012 no new unstable ones Then the L0Hadron behavior can be improved, by either rearranging of PMTs (moving the worst ones – to periphery) or replacing them by spares – a task for LS1. Yu. Guz 13/06/2012
to compare: ECAL rate effect 2012 (May 14-23) >5%: 34 PMTs >10%: 3 PMTs The distribution is similar to HCAL, but no tail at high values. Only 3 cells >10%, all suffer from contact instability, rate effect is moderate. contact instability rate effect Yu. Guz 13/06/2012


![[PDF] Free Download Not Dead Yet By Phil Collins](https://cdn4.slideserve.com/8023372/slide1-dt.jpg)