Download
1 / 63
630 likes | 826 Vues
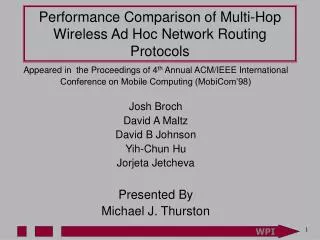
Performance Comparison of Multi-Hop Wireless Ad Hoc Network Routing Protocols. Appeared in the Proceedings of 4 th Annual ACM/IEEE International Conference on Mobile Computing (MobiCom’98) Josh Broch David A Maltz David B Johnson Yih-Chun Hu Jorjeta Jetcheva Presented By

E N D
Performance Comparison of Multi-Hop Wireless Ad Hoc Network Routing Protocols Appeared in the Proceedings of 4th Annual ACM/IEEE International Conference on Mobile Computing (MobiCom’98) Josh Broch David A Maltz David B Johnson Yih-Chun Hu Jorjeta Jetcheva Presented By Michael J. Thurston
About the Authors • David B Johnson Inspiration - Faculty @ CMU • Josh Broch • David A Maltz Perspiration - • Yih-Chun Hu PHD students @ CMU • Jorjeta Jetcheva • The MONARCH Project • MOBILE NETWORK ARCHITECTURE • Originated at CMU in 1992 • Moved to Rice w/ Professor Johnson • Develop networking protocols and protocol interfaces • Research scope includes protocol design, implementation, performance evaluation, and usage-based validation • The goal is to enable mobile hosts to communicate with each other and with stationary or wired hosts, transparently, seamlessly, efficiently using the best network connectivity available
Purpose of This Paper • Compare four routing protocols • Wireless • Ad-hoc • Multi-hop routing problem • Provide realistic, quantitative analysis • Node Mobility • Characteristics of physical layer • Characteristics of air interface
Outline • Background • Simulation environment • Ad-hoc protocols described • Analysis methodology • Simulation results • Additional observations • Conclusion
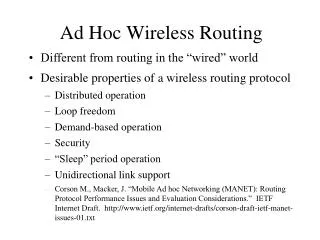
Ad-Hoc Networking • Wireless mobile nodes • “Infrastructure-less” networking • Destination may not be in transmitter range • Node is both host and router • Each node involved in discovery of “Multi-hop” path through network
Ad Hoc Networking Concept UAV Enclave Enclave Enclave MHmosaic - 6 (12/29/98)
Simulation Environment • 50 wireless mobile nodes in a 1500m x 300m space • ns-2 network simulator with modifications • Realistic physical layer (i.e. prop delay) • Node Mobility • Radio network interfaces (i.e. ant gain) • IEEE 802.11 Medium Access Control protocol
Simulation EnvironmentPhysical Layer Model - Propagation • Radio wave attenuation causes degraded receive signal at antenna • Propagation models in free space attenuate receive power by 1/r2 • Models that consider reflection use 1/r4 r = distance between antennas • This model uses both
r < 100 m r > 100 m Simulation EnvironmentPhysical Layer Model - Propagation Free Space Model Receive Power~ 1/r2 Two-Ray Model Receive Power~ 1/r4
Simulation EnvironmentPhysical Layer Model – Mobile Nodes & Network Interfaces • Nodes have position and velocity in a topography (flat/digital elevation) • Nodes have wireless network interfaces • Interfaces of the same type on all nodes are connected by a single physical channel • Physical channel object calculates • Propagation delay to each interface on that channel • Power of received signal at interface • Schedules packet reception event
NI NI NI NI Simulation EnvironmentPhysical Layer Model – Mobile Nodes & Network Interfaces • Receiving interface compares power with carrier sense and receive power thresholds • RCV PWR < Carrier sense thresh then discard as noise • RCV PWR > Carrier sense thresh < RCV thresh then mark packet in error, pass to MAC layer • Else pass to MAC layer Receiving Interface RCV PWR? Sending Interface Physical Channel Object Receiving Interface RCV PWR? Receiving Interface RCV PWR?
Simulation EnvironmentLink Layer Model – MAC protocol • MAC layer receives packet from net interface • If receiver not idle • If RCV PWR of packet in receiver ≥ 10dB higher than new packet then discard new • If RCV PWR < 10 dB higher – collision – discard both • If receiver idle • Compute transmission time • Schedules packet reception complete event • Address filtering and pass up protocol stack • Link Layer uses 802.11 MAC Distributed Coordination Function - uses carrier sense mechanism to reduce collisions • Transmission preceded by RTS/CTS to reserve channel
Simulation EnvironmentOther Characteristics • Address Resolution • An address resolution protocol (ARP) is used to resolve IP addresses to the link layer • ARP requests are broadcast • Packet Buffering • Each node has a drop tail queue to hold up to 50 packets awaiting transmission by net interface • Additional 50 packet queues implemented in DSR and AODV • For packets awaiting discovery of a route
Simulation Environment Ad-Hoc Network Routing Protocols • Implemented according to specs and designer clarifications • Modifications based on experimentation: • Period broadcasts and responses were jittered 0-10ms to prevent synchronization • Routing information queued ahead of ARP and data at network interface • Used link breakage detection feedback from 802.11 MAC except in DSDV
DSDVCharacteristics • Hop-by-hop distance vector protocol • Nodes broadcast periodic routing updates • Guaranteed loop free • Node routing table lists next hop for each destination • Tags “route” in table with sequence number (SN) • Route to destination with higher SN is better • If SN equal then route with lower metric better • Node advertises an increasing even SN for itself
DSDVBasic Mechanisms • When node B decides route to D is broken, B increases SN for that route by one (SN now odd) and advertises the route with an infinite metric • Any node ‘A’ that routes through B adds the infinite metric to their route table • ‘A’ keeps this metric until it hears a new route to D with a higher SN
D advertises even SN 30 • B senses its route to D has broken • B labels route with infinite metric and increases SN to 31 • B adv infinite metric to A • A changes metric • D adv new SN ADV • Nodes propagate new SN SN=30 ADV X SN=32 Dest Dest Dest Dest Dest Dest NH NH NH NH NH NH SN SN SN SN SN SN Met Met Met Met Met Met D D D D D D B B - - - B 30 30 30 30 31 31 2 1 ∞ ∞ ∞ ∞ D D D D D D A C A C A C 32 30 30 30 32 30 3 4 3 4 3 4 DSDVBasic Mechanisms E C A D B
DSDVImplementation Decisions • No 802.11 MAC link layer breakage detection • Node B detects link to D is broken • Increases SN by 1 then broadcasts a triggered route update with infinite metric • All nodes propagate new SN and metric as oppose to only those routing traffic through B rendering node D unreachable • Using DSDV-SQ vs DSDV • When should we send triggered update? • When node receives new SN or just new metric • Update with each new SN requires more overhead • Chose DSDV-SQ despite increased routing overhead because of better packet delivery ratio
TORACharacteristics • On demand distributed routing protocol • Discover routes on demand • Provide multiple routes to destination • Establish routes quickly • Minimize routing overhead by localizing reaction to topological changes • Shortest path routing lower priority • Will use longer route to avoid overhead of discovering new ones • “Link reversal” algorithm • Described as water flowing downhill toward destination
TORABasic Mechanisms – Link Reversal • Network of tubes model routing state of the real network • Tubes represent links, intersections represent nodes • Each node has height with respect to the destination • Here Node A routes through B to destination D A B C D E
TORABasic Mechanisms - Link Reversal • If the tube between nodes B and D becomes blocked, B raises its height with respect to its remaining neighbors • Water flows out of B towards A who had been routing through B B A X C D E
TORABasic Mechanisms – Route Discovery • Each node has a logically separate copy of TORA for each destination D • Broadcasts QUERY with address of D • QUERY propagates through network until it reaches D or a node with route to D • Node receiving QUERY broadcasts UPDATE with nodes height with respect to D • All nodes that receive UPDATE set their height higher than neighbor from which it was received
TORABasic Mechanisms – Route Maintenance • When a node discovers invalid route it • Adjusts height higher than its neighbors • Broadcasts UPDATE • If all neighbors have infinite height then node broadcasts QUERY to discovery new route • If network partition is found (isolated enclave) then node broadcasts CLEAR to reset state
TORAImplementation Decisions • TORA requires in-order delivery of routing control messages so it is layered with IMEP • IMEP provides link sensing and a consistent picture of a node’s neighbors to TORA • Transmit periodic beacon – each node answers with Hello • Queues control messages for aggregation into blocks reducing overhead (TORA excluded - limit long-lived loops) • Blocks carry SN and list of nodes not yet acknowledged • IMEP queues messages for 150-250ms - retransmits block with period 500ms with timeout at 1500ms • Upon timeout IMEP declares link down and notifies TORA
TORAImplementation Decisions • In-order delivery is enforced at receiver by: • Receive node B passes block from A up stack to TORA only if SN = expected SN • Blocks with lower SN are dropped • Blocks with higher SN are queued until missing blocks arrive or up to 1500ms • At 1500ms node A will have declared link to B down • Node B IMEP layer declares link down to maintain consistent picture with node A • Improved IMEP link sensing – require beacons only when node is disconnected from all other nodes
DSRCharacteristics • Source routing protocol • Each packet carries list of nodes in path in its header • Intermediate nodes do not maintain routing information • No need for periodic route ads or neighbor detection
DSRBasic Mechanisms • Source node S uses Route Discovery to find route to destination D • S broadcasts ROUTE REQUEST – flooded in a controlled manner (initial hop limit set to zero, if no reply then propagate) • Answered by D or by a node with route to D with ROUTE REPLY • Each node maintains cache of source routes to limit frequency and propagation or ROUTE REQUESTs • S uses Route Maintenance to detect topology changes that break a source route (i.e. node out of range) • Notifies S with ROUTE ERROR • S can use another cached route or invoke ROUTE REQUEST
DSRImplementation Decisions • DSR supports unidirectional routes • However 802.11 requires RTS/CTS/Data/Ack exchange • Implementation requires ROUTE REPLY from destination via reverse of ROUTE REQUEST • Else S would not learn the unidirectional route • Network Interfaces in promiscuous mode • Protocol receives all packets the interface hears • Learns information about source routes • Route repair • If intermediate node senses broken link it will search cache for alternate route and repair source route
S sends message X with source route C-B-A-D • C forwards message to B • A hears message on physical channel • A reads header and finds self X – CBAD • A broadcasts Gratuitous Reply X – CBAD • Message X continues to D X – CBAD X – CBAD X – CBAD X – CBAD GR – CAD X – …BAD DSRImplementation Mechanism – Promiscuous Mode S B C A D
AODVCharacteristics • Combination of DSR and DSDV • Uses on demand Route Discovery and Route Maintenance of DSR • Hop-by-hop routing, SN and beacons from DSDV
AODVBasic Mechanisms • Route Discovery • Source node S broadcasts ROUTE REQUEST to include last known SN for destination D • Each node along path creates a reverse route back to S • ROUTE REPLY sent by D or by a node with route to D contains # hops to D and last seen SN • Each node in path of REPLY to S create the forward route • State created is hop-by-hop (node only remembers next hop) • Route Maintenance • AODV uses Hello Messages to detect link breakage • Failure to receive three HELLOS indicates link down • Upstream nodes notified by UNSOLICITED ROUTE REPLY containing an infinite metric for that destination
AODVImplementation Decisions • Authors tested another version of AODV that relies only on Link Layer feedback from 802.11 as seen in DSR • Link breakage detection is on demand • Detected only when attempting to send packet • Performance was improved in AODV-LL version • Saves overhead of HELLO messages • Reduced the time before new ROUTE REQUEST is sent if no REPLY was received from 120s to 6s • Nodes hold reverse route information for only 3s • Without this route information a REPLY can’t find source
Analysis Methodology • Goal – compare protocols - not determine the optimum performance in the scenarios • Measure ability to react to changes and deliver packets successfully • Given a variety of workloads, movement patterns and environmental conditions • Compare using 210 scenarios each running for 900s • Radio characteristics modeled after Lucent DSSS radio
Analysis MethodologyMovement Model • Random waypoint model • Node begins simulation stationary for pause time s • Selects random destination and moves at a speed uniformly distributed from 0 and max • Node then pauses again for pause time s • Repeating for the duration of the 900s • 7 pause times 0,30,60,120,300,600,900 s • 0s = constant motion 900s = stationary • 70 movement patterns (10 per each pause time) • Max speed = 20m/s Ave speed 10m/s • Comparison made with Max speed = 1m/s
Analysis MethodologyCommunication Model • Chose CBR sources to maintain exactness of scenario • Fixed send rate at 4 packets/s • Three different patterns with 10,20,30 sources • Protocols determine routes 40,80,120 times/s • Packet size 64-bytes • 1024 byte packets caused congestion due to small simulation space (short RTT) • Did not use TCP because congestion control mechanisms alters sending times making scenarios between protocols different
Analysis MethodologyScenario Characteristics – Route Lengths • Simulator measured the “ideal” lengths of the routes (in hops) in all 210 scenarios • Average data packet traveled 2.6 hops
Analysis MethodologyScenario Characteristics – Connectivity Changes • Link connectivity changes whenever a node leaves radio contact with another node • Jump in # ofchanges of 1m/s max speed at 30spause time isan artifact ofthe scenario
Analysis MethodologyMetrics • Packet delivery ratio • Ratio of the # packets originated by CBR sources to the # received at CBR sink • Completeness and correctness: loss rate - throughput • Routing overhead • Total # of routing packets transmitted during simulation (each hop is one transmission) • Scalability and efficiency in terms of battery power • Path Optimality • The difference between the number of hops taken and the optimum path available • Efficiency of network resources
Simulation ResultsComparison Summary – Packet Delivery Ratio - 20 Sources • Less mobility = better performance • DSR & AODV-LL > 95% • DSDV-SQ fails at pause time < 300s
Simulation ResultsComparison Summary – Routing Overhead - 20 Sources • TORA, DSR, AODV-LL are on- demand protocolsOverhead drops with less mobility • DSDV-SQ is a periodic protocolnear constant overhead with respect to mobility rate
Simulation ResultsDetails Packet Delivery Ratio – All Three Source Rates
Simulation ResultsDetails Packet Delivery Ratio – DSDV-SQ • DSDV-SQ fails at pause time < 300s for all # of sources • Packets dropped because of stale routing table -forced packets over broken links • DSDV-SQ maintains only one route per destination • Packet is dropped if MAC layer is unable to deliver
Simulation ResultsDetails Packet Delivery Ratio – TORA • TORA > 90% for 10, 20 sources • Packet drops from short-lived loops –due to link reversal • Rate drops to 40% with 30 sources at full mobility • Here TORA fails due to congestion collapse
Simulation ResultsDetails Routing Overhead – Comparison for All Sources • TORA, DSR, AODV-LL being on demand protocolsshow overhead increases as sources increase • DSR and AODV-LL have same shape plots but AODV-LL has nearly 5 times the overhead • DSDV-SQ has near constant overhead
Simulation ResultsDetails Routing Overhead – DSR • With increase in sources incremental increase in overhead is proportionally less • Info from one Route Discovery used to complete a new one • DSR uses caching, promiscuous interface, and zero hop route requests to limit overhead
Simulation ResultsDetails Routing Overhead – AODV-LL • Same characteristic as DSR with increasing sources • AODV-LL has up to 5 times the overhead of DSR • Difference due to route discoveries going to every node and lack of caching
Simulation ResultsDetails Routing Overhead – DSDV-SQ • DSDV-SQ has near constant overhead • Destination updates SN each15s • With 50 nodes a periodic update with new SN is being sent every second • New SN generates triggered updates from each node receiving it • Effective rate of triggered updates is one per node per second = 45,000 for 900s simulation