Download
1 / 61
620 likes | 733 Vues
Extreme Precipitaton Events in Arizona John Henz, C.C.M. William Badini, Robert Rahrs and Daniel Henz Hydro-Meteorology Group HDR Inc, – Denver, CO. 4 th Symposium on Hydrometorology – Tucson, AZ September 21, 2004. Brief Intro – HDR.

E N D
Extreme Precipitaton Events in ArizonaJohn Henz, C.C.M. William Badini, Robert Rahrs and Daniel HenzHydro-Meteorology Group HDR Inc, – Denver, CO 4th Symposium on Hydrometorology – Tucson, AZSeptember 21, 2004
Brief Intro – HDR • Over 6,000 employees in over 160 locations (most in US but, also in the UK, Canada and Mexico. • HQ in Omaha, Nebraska. • Providing a range of services predominantly in Engineering Environmental Science and Architecture
John HenzCertified Consulting Meteorologist • Senior Project Manager, HDR Hydro-Meteorological Services • Certified Consulting Meteorologist (1980-current) • Colorado Flood Task and Water Availability Forces since 1993 • Arizona Flood Warning Co-ordination Committee: 1996-2000 • Colorado Extreme Precipitation Committee since 1993 • BS Meteorology, Uni. Of Wis.; MS Atmospheric Science, Colo.St. Univ. • John.Henz@hdrinc.com
Other Team Members Bill Badini • BS, MS - U of Wisconsin (Atmos & Oceanic Sci.) • 10 yrs experience in Quant. Precip. Forecast. In CO, TX and AZ • Worked with Colorado Flood & Water Avail. Task Force Rob Rahrs • BS – Univ of Nebraska (Meteorology) & 80% complete with MS in Engineering: (GIS) at Univ. of Colo.-Denver • 5 years exp. QPF in CO and key project member for GIS integration of weather and climate data. Dan Henz • BS - Univ. of Arizona currently in MS program at Univ. of Wisconsin • 3 years QPF ex. in CO.
Motivation of Project Data utilized in Probable Maximum Precipitation (PMP) study. PMP studies used for dam safety analysis – regulated primarily by state governments PMP used to drive the PMF (Prob. Maximum Flood) which is used to design spillway capacity Overtopping (not enough spillway capacity) is a major risk to dam safety
Definition of Probable Maximum Precipitation • “theoretically the greatest depth of precipitation for a given duration that is physically possible over a given storm area at a particular geographic location at a certain time of year” ……. Definition from HMR-55A.
Arizona historical extreme precipitation event climatology: 1850-early 2005
Sources of historical events • HMR-49 and HMR-50: 28 general storms and 35 local storms in Arizona, Colorado, Utah and southeastern California. • NOAA-NCDC Storm Data: 1959-2005 • NWS-Tucson listing of SE Arizona flooding events • FCDMC and PCFCD • Arizona State Climatologist • University of Arizona Atmospheric Science Dept.
August 23, 2005Tucsonfloodsmost frommonsoont-storm 4th greatest flow
When do Arizona extreme precipitation events like to occur during the year? August 28 July 21 January 8
Causes of Arizona extreme precipitation events during the year (190 events). Tropical storms Monsoon t-storms Pacific storms
Monsoon storms to sub-tropical disturbances Rillitio Wash – Tucson 1983 Santa Cruz River 1993 Gilbert 2003
Arizona’s annual precipitationshows the impacts of mountain ranges and deserts clearly.
Arizona’s annual precipitationshows the impacts of mountain ranges and deserts clearly.In short, all storms are not created equal.
Two primary sources of Arizona floods: • General storms moving across the state during winter producing prolonged upslope rain/snow or sub-tropical storms/decaying hurricanes during August to October. • Intense thunderstorms occurring during the summer monsoon season: mid-July to mid-September.
During PMP Project - select the critical local and general storms217 possible storm events • List storms by precipitation amount, duration and elevation. • Determine meteorological cause. • Review physical location and topography of the event. • Determine the 5-10 most extreme local and general storm events for further evaluation (for PMP study).
Local Storm Discussion Local Storms defined as events under 6 hours for duration of primary rainfall
Let’s get the rainfall pattern’s areal coverage: length and width
Let’s use WSR-88D Doppler radar to define size using STP and duration from reflectivity.
Example: September 9, 2003 • Report of 10” of rain overnight at Roosevelt Dam. Persistent heavy rains flooded nearby creeks and 200 homes damaged. • What happened, where and how much? • Check newspapers, eyewitness reports and stream flow records. • Questions remain: when did it start? How much rain fell in what period of time? What was the areal distribution?
Flagstaff NWS WSR-88D Doppler radar Storm Total Precipitation Map
Phoenix NWS WSR-88D Doppler radar Storm Total Precipitation Map
Some details obtained from the radar records of the Roosevelt Lakes storm. • Three distinct rain areas of >6” each associated with a topographic feature and a separate thunderstorm cell. • The heaviest rain areas were about 7 miles by 3 miles in size and embedded within an area of > 3” rains that was about 25 miles by 10 miles. • Duration was about 4.5 hours with three spurts of about 45-60 minutes. • Storms moved from northeast to southwest along the 045-225 radial.
STP – WSR-88D Tucson July 24, 2003
PWI =1.20”Updraft > 0C =2.7kmHourly rain rate~2.60” 1.20 times 2.7/2.5 times 2 = 2.6”/hr 95 61
PWI =1.20”Updraft > 0C =2.7kmHourly rain rate~2.603hrs= 7.80” 61 95
Sabino Canyon storm – July 15, 1999 • 6-7 inches of rain fell at elevations of 6,000ft to 7,400ft. • Occurred over a 5.5hr to 6.5 hr period. • Winds were from the southwest to northeast. • Not one storm but repeated storm development over the same terrain feature. • Happened on the windward side of the mountains.
Sabino Canyon storm – July 31, 2006“The sequel” – This time not quite as bad as the prior but, still worth looking at….
Critical Local-Storm List for the SW Arizona Basin PMP Study
General storms: Definition per PMP nomenclature – events where the rainfall was greater than 6 hours in duration.
General storms: Two biggest events: Hurricanes Norma in 1970 and Hurricane Nora in 1997
Schematic of rain-producing winds in a decaying sub-tropical disturbance forced to gradually raise upslope without thunderstorm activity. (AGL= above ground level)
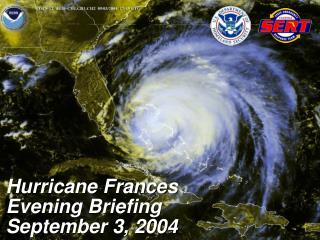
Satellite photo of Tropical Storm Nora entering Arizona on September 25, 1997. H = Harquahala Peak and W = Workman Gulch W H
NWS WSR-88D radar reflectivity observation of Nora rain bands on 9-25-97.
Precipitation caused by passage of Hurricane Nora on September 25, 1997.
Precipitation caused by passage of Hurricane Nora on September 25, 1997. State record 24 hr precipitation
Temporal Distribution of Rainfall…very important to know when dealing with events.
Recommendation: State of Arizona consider using observed temporal and areal coverage observations of Arizona extreme storms for • Calculation of basin coverage. • Temporal distribution of extreme events measured by either rain gages or WSR-88D Doppler radars of NWS.
Recommendation: State of Arizona consider undertaking two studies of extreme precipitation related events: • An Arizona Extreme Precipitation Data Study similar to the one recently completed in Colorado (CCC, 1997). This study would form the basis for future site-specific and regional PMP studies. • A radar evaluation of the areal coverage and temporal duration of extreme precipitation events using NWS WSR-99D Doppler radar observations of storm total precipitation (STP) fields.