Advanced Hurricane Research: Insights and Forecast Evaluation
290 likes | 393 Vues
Explore the ocean as an energy source for hurricanes and the dynamics of convection in tropical storms. Learn about instruments, logistics, and methods for improving forecast evaluations.

Advanced Hurricane Research: Insights and Forecast Evaluation
E N D
Presentation Transcript
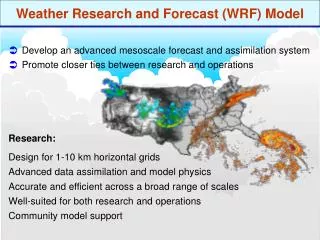
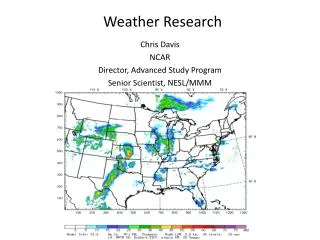
Weather Research Chris Davis NCAR Director, Advanced Study Program Senior Scientist, NESL/MMM
Hurricane Research Images of Ike Courtesy CIMSS SSEC
Hurricanes • Ocean is the energy source • Condensation heating drives radial circulation • Strongly rotational: convection and deformation radius similar • Strong differential rotation in outer region, near-solid-body in eye From Houze (2010), who adapted from Wallace and Hobbs (2006)
African Easterly Wave (AEW) Berry et al., 2007: Monthly Weather Review
AEWs: An example Berry et al., 2007: Monthly Weather Review
Surface Circulation from Dropsonde Data and GOES-12 IR, Pre-Fay 2008
850 hPa Flow in the Resting Frame 850 hPa Flow in the Moving Frame
PREDICT (PRE-Depression Investigation of Cloud-systems in the Tropics)Instruments and Logistics • 15 August – 30 Sept. 2010 • Base: St. Croix Virgin Islands • NCAR G-V: 200 research hours • 10+ disturbances sampled, 25 flights • 550 dropsondes • Microwave Temperature Profiler • Differential GPS • Small Ice Detector • Cloud Particle Imager • CVI Crew 1 Crew 2 15 Aug. 1 Sept. 15 Sept. 30 Sept. Double-crewed G-V, 1-15 Sept.
Global Hawk (Dryden) DC-8, (ER-2) NCAR G-V NOAA P-3
Inflow Schematic of the “Pouch” Saharan Air Layer Trough Moist Jet CL
Flight Timing1 G-V Flight (9-10 h) G-V 40,000 ft G-IV DC-8 P-3 10,000 ft 12 UTC 18 UTC 00 UTC 06 UTC 12 UTC
Flight Timing2 G-V flights (7-7.5 h) G-V G-V 40,000 ft G-IV DC-8 P-3 10,000 ft 12 UTC 18 UTC 00 UTC 06 UTC 12 UTC
Inflow Schematic of the “Pouch” Saharan Air Layer Trough Moist Jet CL
G-V “Square-Spiral” with NOAA 1 2 5 7 4 6 3 Shading: GOES-IR imagery Zonally translated 700 hPa streamlines (C~ -6 m/s)
Previous version of Advanced Hurricane WRF (AHW) Latest version of Advanced Hurricane WRF (AHW)
Previous version of Advanced Hurricane WRF (AHW) Latest version of Advanced Hurricane WRF (AHW)
Forecast Evaluation • How does one demonstrate one set of forecasts is better than another?
Some Common Methods • The “eyeball” method: “It just looks better” • Expectations: “This is a much more sophisticated model, therefore…” • Regional focus: “This model is better somewhere…” • Blind statistics: Reward for mediocrity • Case study: problem of generalization
L W Object Attributes • Intensity (percentile value) • Area (# grid points > T) • Centroid • Axis angle (rel. to E-W) • Aspect ratio (W/L) • Fractional Area • Curvature 75th Percentile Median 25th Percentile R=16 km; T = 5 mm h-1 Raw Forecast (28 h, 04 UTC 11 June)
Defining the Quality of a Match • “Interest” (I) is defined for the jth pair of objects (forecast and observed) • Range of 0 to 1 ICP Workshop, August 24-25, 2009
Interest Matrix ICP Workshop, August 24-25, 2009
IHOP, June 15, 2002 ARW Stage IV Time (0-36 h) Colors do not indicate matching AMS 23 WAF, 19 NWP
U. Mass, Amherst, MA Physics MIT, Cambridge, MA Meteorology
Leadership (a personal view) • Evolved rather than planned • Balanced perspective • Result of accumulated rather than singular actions • Mix of reservation, confidence and empathy ?
Advanced Study Program • Postdoctoral Fellowships • Faculty Fellowships • Graduate Student Visitors • The attractions? • Opportunities for mentoring early career scientists • Exposure to wide range of science topics