Download

1 / 27
280 likes | 512 Vues
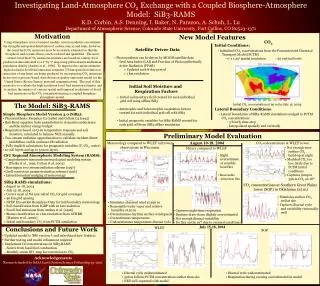
Biosphere Atmosphere Exchange. 1) Directly emitted GHGs CO 2 , CH 4 , N 2 O 2) Chemical sources of GHGs and SOA BVOCs CO CO 2 BVOC aerosol 3) Effects of biogenic emissions on O 3 , OH and NO 3 NO x BVOC H 2 CO BVOC + O 3 OH.

E N D
Biosphere Atmosphere Exchange 1) Directly emitted GHGs CO2, CH4, N2O 2) Chemical sources of GHGs and SOA BVOCs CO CO2 BVOC aerosol 3) Effects of biogenic emissions on O3, OH and NO3 NOx BVOC H2CO BVOC + O3 OH
What are the magnitudes of these sources? • How are they distributed, in time and space? • How do they impact atmospheric chemistry & global greenhouse gases? • What are the emissions of “natural systems”? • What are the effects of management, e.g. fertilizer, timber forests?
Satellite observations that will contribute Molecules: CO2, CO, CH4, NO2, O3, H2CO, glyoxal Aerosol properties
Diffuse human-caused sources account for 365 in a total of 550 (70%). Agriculture accounts for 175 (30%) SOURCES OF ATMOSPHERIC METHANE BIOMASS BURNING 20 ANIMALS 90 WETLANDS 180 LANDFILLS 50 GLOBAL METHANE SOURCES (Tg CH4 yr-1) GAS 60 TERMITES 25 COAL 40 RICE 85
Growth of CH4 slowed dramatically after 1991. Will increases resume? The vertical gradient over the Midwest is comparable to the gradient in the Amazon. CH4 over North Dakota Summer, 2000 (COBRA)
S. Del Grosso, S. Ogle and B. Parton, in review Total ~ 0.6 TgN/yr, 15% of global total
SOURCES (Tg N yr-1) 18 (7 – 37) Natural 10 (5 – 16) Ocean 3 (1 - 5) Tropical soils 4 (3 – 6) Temperate soils 2 (1 – 4) Anthropogenic 8 (2 – 21) Agricultural soils 4 (1 – 15) Livestock 2 (1 – 3) Industrial 1 (1 – 2) SINK (Tg N yr-1) Photolysis and oxidation in stratosphere 12 (9 – 16) ACCUMULATION (Tg N yr-1) 4 (3 – 5) PRESENT-DAY GLOBAL BUDGET OF ATMOSPHERIC N2O IPCC [2001] Although a closed budget can be constructed, uncertainties in sources are large! (N2O atm mass = 5.13 1018 kg x 3.1 10-7 x28/29 = 1535 Tg )
2) Chemical Sources of GHGs and aerosol(BVOCs, 1000’s of compounds) • Isoprene (C5H8) • Monoterpenes (C10H16) • Oxygenated VOC • Sesquiterpenes (C15H24) Amount Known
Methanol Agriculture produces a wide variety of highly reactive hydrocarbons, often in large quantities. Concentrations and fluxes of oxygenated HCs over an alfalfa field in Colorado. Mixing ratio (ppb) Acetaldehyde Acetone Methanol Acetaldehyde Flux (mg m-2 hr-1) Acetone C.Warneke et al., 2002
Nucleation (oxidation products) Oxidation Reactions (OH, O3, NO3) Growth Isoprene Mono- and Sesquiterpene Emissions Condensation on pre-existing aerosol Nucleation (unlikely) Secondary Organic Aerosol (SOA) Production from biogenic VOC emissions Graphic from M. Lunden
~1300 Biogenic + Anthropogenic Global VOC Emissions 310-720 Oxidation to CO/CO2`` 130-270 Dry + Wet Deposition Atmospheric VOC 50-200 Oxidation to VOC/CO/CO2 510-910 SOA Formation Secondary Organic Aerosol 175-375 Dry + Wet Deposition Units Tg C yr-1 Goldstein and Galbally, ES&T 2007
3) O3, OH, NO3 Biogenic NOx emissions: OH, NO3,and O3 BVOC H2CO, aerosol oxidation? O3 + BVOC OH + products
Partitioning of Global NOx Sources Based on Jaegle et al. Faraday Discussions, 130, 407-423, DOI: 10.1039/b502128f, 2005 Cohen Group Meeting 31 August 2005
SCIAMACHY Soil NOx Observations - Montana Bertram et al GRL 2005 Cohen Group Meeting 31 August 2005
Local Tuning of Y&L Soil NOx Model Cohen Group Meeting 31 August 2005
Terpenes and isoprene are source of H2CO Lee et al., JGR, 2006.
Terpenes + O3 OH + OxProducts Growing body of evidence that BVOC emissions are a strong source of OH both within the forest canopy and above.
Goldstein et al. GRL and ACP • Chemical O3 deposition • Rapid Production of secondary VOC products • Helmig et al. ES&T • Sesquiterpene emissions are 20% of monoterpene emissions for several pine species • Brune et al. JGR/Science • Excess OH observed in regions of high biogenic emissions including ground sites in Alabama, Nashville and Michigan and from the aircraft. • Higher OH reactivity than accounted for by measured VOC associated with biogenics • Cohen ACP • HNO3 flux over a pine forest is upward implying 5-10 times more OH in the forest canopy than above • Martinez (MPI-Mainz) • Excess OH correlated with isoprene over Surinam • Kulmala et al. • Evidence in modeling and aerosol over forest in Finland
Summer (June-August) Blodgett Forest Farmer and Cohen, in preparation mixing ratio (ppb) flux (ppb m s-1) ∑PNs ∑ANs HNO3 NO2
HNO3flux (ppb m s-1) Summer—HNO3 flux Focus on noon
Summer—HNO3 flux Based on flux-gradient relationships 12 Calculated based on deposition velocity 11 10 9 8 Height (m) 7 Chemistry 6 5 0.46 0.48 0.50 HNO3 (ppb)
OH+NO2HNO3 OHcanopy = 3.1 x 10⁷ molec∙cm-3 background OH ~5 x 10⁶ molec∙cm-3 Residence time in the canopy is about 600 sec NO2 = 300ppt Solve for OH needed to produce HNO3 that is identified as chemical. OH = 3.1 x 10⁷ molec∙cm-3
-Ciccioli et al. [1999]sesquiterpenes in leaf enclosures were not observed above the canopy – Burriana orange orchard, Spain. -Kulmala et al., [2000] Aerosol growth Hyytiala Forest, Finland From BVOC? -Di Carlo et al. [2004] Measured– Calculated OH Loss Inferred unmeasured reactive BVOCs.
Mission Direct GHG and NOx emissions Industrial agriculture—target areas just after rain on recently fertilized fields, follow evolution over several days. Key goal verify/understand timing patterns so that can interpret satellite observations at one time of day. Forest Emissions: Reactivity, Aerosol Visit forests at that experience high T (maximum emissions). Bring new instruments capable of establishing links between BVOC emissions, OH and aerosol composition.
Conclusions • A focussed effort aimed at understanding: • the timing and spatial patterns of biogenic emissions • the propagation of these emissions as a result of exchange across the PBL and convection and • the gas and aerosol chemistry of emissions • would likely provide exciting new scientific results.