Download
1 / 1
10 likes | 193 Vues
Investigating Land-Atmosphere CO 2 Exchange with a Coupled Biosphere-Atmosphere Model: SiB3-RAMS K.D. Corbin, A.S. Denning, I. Baker, N. Parazoo, A. Schuh, L. Lu Department of Atmospheric Science, Colorado State University, Fort Collins, CO 80523-1371. Motivation

E N D
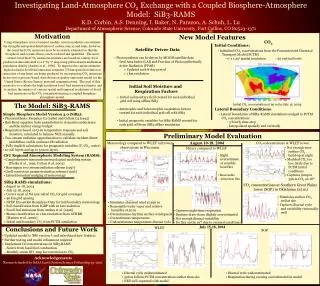
Investigating Land-Atmosphere CO2 Exchange with a Coupled Biosphere-Atmosphere Model: SiB3-RAMS K.D. Corbin, A.S. Denning, I. Baker, N. Parazoo, A. Schuh, L. Lu Department of Atmospheric Science, Colorado State University, Fort Collins, CO 80523-1371 Motivation Using atmospheric tracer transport models, inverse modelers can estimate the strengths and spatial distribution of carbon sources and sinks; however, the fossil fuel CO2 emissions must be accurately estimated so that the biospheric and oceanic fluxes can be isolated and quantified. The most current fossil fuel CO2 emissions estimates are based on country level production data allocated to a 1o by 1o map using political units and human population density [Andres et al., 1996]. To improve the current estimates, high-resolution fossil fuel emissions estimates (36 km spatial resolution at timescales of one hour) are being produced by incorporating CO2 emissions factors into a process-based, data-driven air quality emissions model for the United States [Kevin Gurney, personal communication]. The goal of this research is to evaluate the high-resolution fossil fuel emission estimates and to analyze the impacts of various spatial and temporal resolutions of fossil fuel emissions on the CO2 concentration using a coupled biosphere-atmosphere model. New Model Features CO2 Initial Conditions: Satellite Driver Data • Initialized CO2 concentrations from the Parameterized Chemical • Transport Model (PCTM) • - 1o x 1.25o spatial resolution - 20 vertical levels • Photosynthesis can be driven by MODIS satellite data • - Leaf Area Index (LAI) and Fraction of Photosynthetically • Active Radiation (FPAR) • > Updated each 8-day period • > 1 km resolution Initial Soil Moisture and Respiration Factors • Initial soil moisture field created for each individual • grid cell using offline SiB3 • Autotrophic and heterotrophic respiration factors • created for each individual grid cell with SiB3 • Initial prognostic variables for SiB3-RAMS created for • each grid cell from SiB3 offline simulation The Model: SiB3-RAMS Initial CO2 concentration at 30 m for July 15, 2004. Lateral Boundary Conditions: The Model: SiB3-RAMS • Simple Biosphere Model Version 3.0 (SiB3): • Photosynthesis: Farquhar C3 (1980) and Collatz C4 (1992) • Ball-Berry equation links assimilation to stomatal conductance • and the surface energy budget • Respiration based on Q-10 temperature response and soil • moisture, calculated to balance NEE annually • Two-stream radiation approximation to calculate incident direct • and diffuse visible and near-IR radiation • Fully implicit calculations for prognostic variables (T, CO2, water) • 10 soil layers and up to 5 snow layers • Lateral boundaries of SiB3-RAMS simulations nudged to PCTM • CO2 concentrations • - 3 hourly time-step • - Interpolated spatially and vertically Preliminary Model Evaluation August 10-18, 2004 Meteorology compared to WLEF tall tower observations in Wisconsin CO2 concentrations at WLEF tower • Not enough near- • surface CO2 • build-up at night • Modeled CO2 too • low, likely due to • PCTM initial • conditions • Captures jump in • 396 m CO2 on 16th Fluxes compared to WLEF • CSU Regional Atmospheric Modeling System (RAMS): • Comprehensive mesoscale meteorological modeling system • [Pielke et al., 1992; Cotton et al. 2002] • Harrington two-stream radiation scheme [1997] • Grell convection parameterization scheme [1993] • Lateral boundary nudging of meteorology • Slight • overestimate • of sensible • heat flux • Reasonable • latent heat flux • SiB3-RAMS simulations: • August 10-18, 2004 • July 15-18, 2004 • Covers most of NA (see initial CO2 for grid coverage) • 40 km grid spacing • NCEP Eta-40 km Reanalysis Data for init/boundary meteorology • Soil classification from IGBP with 10 km resolution • Fossil fuel emissions from Andres et al. [1996] • Biome classification at 1 km resolution from AVHRR • [Hansen et al., 2000] • Initial and boundary CO2 from PCTM simulation CO2 concentrations at Southern Great Plains tower (SGP) in Oklahoma (25 m) • Simulates surface CO2 • well at site • Captures diurnal cycle • and variability reasonably • well • Simulates observed wind at 396 m • Reasonable water vapor and relative • humidity at 30 m • Overestimates daytime surface windspeeds • Overestimates temperature • Underestimates temperature diurnal cycle • Captures night-time respiration • Daytime draw-down slightly overestimated • Not enough diurnal variability • No flux on the 10th due to overcast conditions July 15-18, 2004 WLEF Conclusions and Future Work • Updated model to SiB version 3 and introduced new features • Further testing and model refinement required • Implement CO concentrations in SiB3-RAMS • - Source from fossil fuel combustion • - Monthly-mean OH map for conversion to CO2 SGP Acknowledgements Research funded by NASA Earth System Science Fellowship 53-1970. • Diurnal cycle underestimated • 396 m follows PCTM concentrations rather than obs • NEE well-captured with model • Diurnal cycle underestimated • Respiration during evening overestimated in model