Proposal Science Issues
Explore the impact of past and future ozone changes on climate dynamics using interactive simulations and statistical trend analysis. Experiment with varying factors like halogens, volcanic aerosols, and solar cycles to predict ozone recovery outcomes in a changing climate scenario.

Proposal Science Issues
E N D
Presentation Transcript
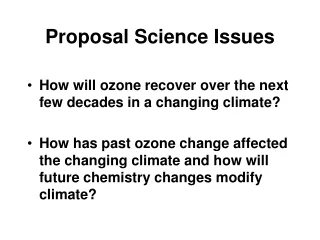
Proposal Science Issues • How will ozone recover over the next few decades in a changing climate? • How has past ozone change affected the changing climate and how will future chemistry changes modify climate?
Basic Philosophy • Get to fully interactive chemistry/dynamics through step-by-step simulations • Key is ability to use model(s) in experiment mode. • Get an idea from analysis • Formulate experiment • Run experiment, analyze results • Requires computer throughput
CTM 50-year 1973-2022 with Halogens, volcanic aerosols, solar cycle 20-year 1979-1999 without volcanic aerosols 9-year 1973-1981 with Pinatubo aerosols in 1975 GCM 50-year 1949-1998 with varying SST 50-year 1949-1998 with AMIP repeating SST 50-year 1949-1998 with mean repeating SST 20-year with 1979 ozone in radiation code 20-year with 1999 ozone in radiation code Runs completed or now running
50-year CTM Integration Total Column Ozone from Model Model run includes chlorine variation volcanic aerosols, solar cycle, and dynamic variability. We can deduce the impact of each by statistical trend analysis, although this is imperfect. But with a model we can do the experiment!
CTM 50-year 1973-2022 with Halogens, volcanic aerosols, solar cycle 20-year 1979-1999 without volcanic aerosols 9-year 1973-1981 with Pinatubo aerosols in 1975 GCM 50-year 1949-1998 with varying SST 50-year 1949-1998 with AMIP repeating SST 50-year 1949-1998 with mean repeating SST 20-year with 1979 ozone in radiation code 20-year with 1999 ozone in radiation code Runs completed or now running
CTM run Without Volcanic AerosolsDifference from basic 50-year simulation averaged over the entire year of 1992 NOx conversion to HNO3 decreases ozone loss NOx conversion to HNO3 decreases Interference with Chlorine and thus Increases ozone loss The model difference can be further examined for changes in chemical catalytic cycles.
CTM 50-year 1973-2022 with Halogens, volcanic aerosols, solar cycle 20-year 1979-1999 without volcanic aerosols 9-year 1973-1981 with Pinatubo aerosols in 1975 GCM 50-year 1949-1998 with varying SST 50-year 1949-1998 with AMIP repeating SST 50-year 1949-1998 with mean repeating SST 20-year with 1979 ozone in radiation code 20-year with 1999 ozone in radiation code Runs completed or now running
What if Pinatubo erupted into a low-chlorine stratosphere? Low chlorine means that volcanic aerosols mostly reduce NOx loss while there is less chlorine loss to be interfered with.
CTM 50-year 1973-2022 with Halogens, volcanic aerosols, solar cycle 20-year 1979-1999 without volcanic aerosols 9-year 1973-1981 with Pinatubo aerosols in 1975 GCM 50-year 1949-1998 with varying SST 50-year 1949-1998 with AMIP repeating SST 50-year 1949-1998 with mean repeating SST 20-year with 1979 ozone in radiation code 20-year with 1999 ozone in radiation code Runs completed or now running
20-year Average of Surface Temperature Difference at Each model point between simulations for 1979 ozone and 1999 ozone Increases in yellow to red, decreases in blue to purple. Maximum increase and decrease about 0.8K SST constant in both runs
Test of Significance of Surface Temperature Changes At each point calculate the standard deviation divided by the square root of 12 months times 20 years to get standard error of mean. At left is ratio of mean difference at each point divided by the standard error of the mean. Yellow to red indicates greater than 2 standard errors of signficance
Probability Distribution of Surface Temperature Differences between GCM Runs with 1999 ozone vs 1979 ozone in radiation code 4.9% > 2 sigma 32% > 1 sigma i.e. Random-if there is an effect the run is not long enough to demonstrate it. -8 0 8 Difference x 10
On-line chemistry 1-year using stratospheric integrator Testing strat-trop integrator Coupled Chemistry None yet Runs completed or now running
Runs we would like to (should) do CTM • Time-slice with more chlorine (~5-7 ppbv) • Test cycle interaction at larger chlorine • Also evaluates what could have been • Chlorine change without solar cycle • Clearly separates solar cycle • Basis for tests of possible solar cycle in circulation • Hindcast with cold NH winter (GMI) • Gives envelope for ozone recovery • Hindcast with warm NH winter (GMI) • Gives other side of envelope for ozone recovery • Extend ozone recovery of 50-year run beyond 2022 to maybe 2050 • Go to “complete” recovery
Runs we would like to (should) do GCM • Redo 20-year delta ozone runs with interactive SST • Surface temperature changes are dampened in constant SST runs • Gives full response to test radiative forcing • Extend 20-year delta ozone runs for increased significance of changes • Only significant difference so far is delay of Antarctic vortex breakup and a change in residual circulation • 20-year run with PV-theta ozone climatology • Test the importance of having ozone heating correlate with wave structures for radiative damping • Time slice run (20+ years) preindustrial vs present tropospheric ozone • Test impact of changes in tropospheric ozone from 1900 to present on surface temperature and meteorology
Runs we would like to (should) do On-line chemistry • 5-year test with stratospheric integrator • On-line/off-line test • Preparation for coupled stratospheric chemistry • Few-month test with strat-trop integrator • Test timing to see how much speed up is necessary for useful experiments • Speed up options tests with strat-trop integrator • Evaluate various methods that are suggested
Runs we would like to (should) do Coupled Chemistry • Ozone hole recovery test • Chemistry simulation with interactive vortex • 50-year stratospheric hindcast/forecast run • Extend hindcast to model with all connections that we know • Does it reproduce data better? • Time slice preindustrial trop-strat chemistry • Preparation for long simulation run • Time slice present trop-strat chemistry • Get statistics of present chemical situation rather than just the meteorology of a single year • Time slice future (2100) trop-strat chemistry • Statistics of where we think we are going • THINK BIG - 250 year trop strat run 1850-2100 • The ultimate simulation
What should be scope of proposal? • Preliminary experiments to understand feedbacks • Online chemistry • Fully-coupled stratosphere • Fully-coupled strat-trop chemistry • Tropospheri chemistry experiments
Interactions • What is relationship with GMI? • How do we relate to GMAO? • How does GISS figure in this? • What about WACCM?
Fully interactive model Dynamical Core heating, surface stress Chemistry Source gases, solar, T,wind Tests: 1979 ozone 1999 ozone Land Q, solar Radiation Ta, Ts, solar, Ocean Q, solar Tests: Varying SST Fixed SST
Model variables for time slice experiments (current model) • Chemical source gases • Green house gas levels (pre-industrial to doubled CO2) • Volcanic aerosol levels (background or Pinatubo) • Solar (max/min or mean) • Sea surface temperatures (max/min or mean) • Extreme chemistry - use that to test radiative impact (1-7 ppb Cly) • Extreme radiative forcing - use that to test chemistry (250 ppm - 680 ppm CO2) • Extreme surface conditions - test radiative & dynamical changes (warm year vs. cold year) • CTM/FVGCM: Run FVGCM run CTM re-run FVGCM with CTM O3 compare runs