Download
1 / 21
210 likes | 365 Vues
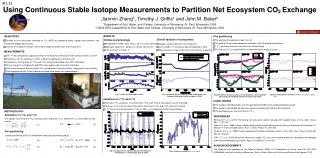
Modeling Environmental Controls on Net Ecosystem CO 2 Exchange of a Tropical Bog. Symon Mezbahuddin 1 , Robert Grant 1 and Takashi Hirano 2. 1 Department of Renewable Resources, University of Alberta, Canada 2 Research Faculty of Agriculture, Hokkaido University, Japan. Introduction.

E N D
Modeling Environmental Controls on Net Ecosystem CO2 Exchange of a Tropical Bog Symon Mezbahuddin1,Robert Grant1 and Takashi Hirano2 1Department of Renewable Resources, University of Alberta, Canada 2Research Faculty of Agriculture, Hokkaido University, Japan
Introduction Bogs are the peatland ecosystems that get water and nutrient inputs only through precipitation Drier weather resultant of increased climatic events such as El-Niño could alter balance between tropical peatland ecosystem photosynthesis and respiration and contribute to increasing atmospheric CO2 Eddy covariance (EC) net ecosystem productivity (NEP) estimates of natural tropical peatlands range from -296 to -594g C m-2y-1[Hirano et al. 2009] Ecosystem processes X multiple environmental factors cause large variations and uncertainties in predictions of peatland ecosystem response to climate change
Objectives To examine how wetter vs. drier weather conditions cause diurnal, seasonal and interannual variations in net ecosystem CO2exchange of a tropical bog [Sebangau River, Palangka Raya, Central Kalimantan, Indonesia; MAT: 26.3C and MAP: 2600 mm] by using hourly time step process based ecosystem model ecosys (Grant et al. 2001)tested against valid eddy covariance data. *Eddy covariance and micrometeorological data (2002-2005) were collected from flux station over the site (23042S; 114211E ) through AsiaFlux Network.
Objectives contd. 2003 (Total precipitation = 2291 mm) 2005 (Total precipitation = 2620 mm) Wet year Dry year (m3m-3) (m3m-3) Figure: Hourly measured precipitation and soil water content at 0-20cm depth during 2003 and 2005 over Palangka Raya peat swamp forest, Indonesia
Hypothesis - I NEP = GPP - RE Conceptual Hypotheses Increased atmospheric dryness Reduced precipitation Reduced soil water content Increased vapour pressure deficit Decreased soil, root and canopy water potentials Higher potential transpiration Increased stomatal resistance and consequent stomatal closure Less actual transpiration at a cost of CO2 fixation and hence reduced GPP
Hypothesis - II Oxic NEP = GPP - RE WT Reduced soil water content Conceptual Hypotheses contd. Water table drawdown WT Anoxic Increased peat aeration Reduced heat capacity of soil Rapid aerobic peat decomposition Increased soil temperature Higher heterotrophic respiration Faster biogeochemical reaction Increased ecosystem respiration
Hypothesis - III However, Desiccation Surface peat desiccation Inhibition of heterotrophic respiration at surface layers Hypotheses contd. WT Partial or complete offset of any increment in heterotrophic respiration stimulated by deeper peat aeration Reduction or elimination of drier and warmer weather effects on NEP through its impact on RE
Tower fetches: 0.4 km N; >5 km S; 0.5 km E; 1.5 km W ⦿ Woody peat ⦿>10,000 years BP ⦿ Natural swamp forest ⦿~ 4m thick ⦿Drainage, partial thinning ~8 years before flux tower installation Study Site Figure: Map of the study site Picture courtesy: (Hirano et al. 2007)
Modeling Experiment (a) ⦿ A modeled tropical peat swamp ecosystem of 100 years spin up run using repeated hourly weather cycles (2002-2005) ⦿ The spinning period allowed the modeled ecosystem to grow, regenerate and attain dynamic C equilibrium ⦿ Soil and vegetation characteristics are from site measured data reported in different studies (b) (b) Figure: Modeling experiment layout (a) horizontal and (b) vertical
Preliminary Results 2003 (dry year) (m3m-3) Figure: Hourly measured (dots) and simulated (lines) precipitation, soil water content at 0-20cm depth and daily water table depths during 2003 over Palangka Raya peat swamp forest, Indonesia
Preliminary Results contd. 2005 (wet year) (m3m-3) Figure: Hourly measured (dots) and simulated (lines) precipitation, soil water content at 0-20cm depth and daily water table depths during 2005 over Palangka Raya peat swamp forest, Indonesia
Preliminary Results contd. 2005 (wet year) 2003 (dry year) Figure: Hourly measured vapour pressure deficit during 2005 and 2003 over Palangka Raya peat swamp forest, Indonesia
Preliminary Results contd. H/LE=0.36 (Rn >700 Wm-2) 2005 (wet year) + influxes - effluxes 2003 (dry year) H/LE=0.62 (Rn >700 Wm-2) Figure: Hourly measured (dots) and simulated (lines) ecosystem net radiation (Rn), latent heat (LE) and sensible heat (H) fluxes during 2005 and 2003 over Palangka Raya peat swamp forest, Indonesia
Preliminary Results contd. 2005 (wet year) + influxes - effluxes 0.25 mm 2003 (dry year) Figure: Hourly measured (closed symbol), gap filled (open symbol) and simulated (lines) ecosystem CO2 fluxes during 2005 and 2003 over Palangka Raya peat swamp forest, Indonesia
Preliminary Results contd. Table: Regression results of simulated vs measured hourly parameters (2003-2005) Rn = Net radiation; LE = Latent heat flux; H= Sensible heat; = Soil water content; Ts = Soil temperature Table: Regression results of simulated vs measured daily water table depths (m) (2004-2005) 1intercept and 2slope from regression of simulated over measured data; 3root mean square for differences from regression of measured over simulated data; 4root mean square of random measurement errors calculated for the measured data based on algorithms described in Richardson et al. (2006)
Preliminary Results contd. 2003 (dry year) (m3m-3) +NEP = C sink - NEP = C source Open symbols have >50% gap filled data Figure: Hourly measured (dots) and simulated (lines) soil water content; three day moving averages of measured (dots) and simulated (lines) evapotranspiration and net ecosystem productivity during 2003 over Palangka Raya peat swamp forest, Indonesia
Preliminary Results contd. 2005 (wet year) (m3m-3) +NEP = C sink - NEP = C source Open symbols have >50% gap filled data Figure: Hourly measured (dots) and simulated (lines) soil water content; three day moving averages of measured (dots) and simulated (lines) evapotranspiration and net ecosystem productivity during 2005 over Palangka Raya peat swamp forest, Indonesia
Preliminary Results contd. Table: Annual ecosystem carbon balance for Palangka Raya Drained forest, Indonesia during 2003 and 2005 1Hirano et al. 2007; 2Henson 2005; 3Suzuki et al. 1999; 4Melling et al. 2005; 5 Kosugi et al. 2008; 5Jauhianen et al. 2005
Summary There was not a complete shift in ecosystem energy balance due to water stress resultant of prolonged dry season. Still a reduction in Bowen ratio (H/LE) due to drier weather condition resulted lower GPP contributing to lower NEP as evident in both EC-gap filled and simulated CO2 fluxes.
Summary contd. Ecosys couldn’t up to this point fully capture the large negative NEPs at the onset of the dry season. So, we remain inconclusive about our hypothesis of a possible increase in ecosystem respiration stimulated by water table drawdown in drier years. We are currently working on that. Peatlands widely vary in their physicochemical characteristics. Rigorous testing of process based models based on our current fundamental understanding across contrasting peatlands would be interesting to improve our insights on peat carbon cycling.
Acknowledgements • Mary Louise Imrie Travel Grant • AsiaFlux Network • NSERC Discovery Grant • Faculty of Graduate Studies and Research, University of Alberta • University of Alberta Computing Facilities • All of my lab group members. Thank You