Download
1 / 38
380 likes | 446 Vues
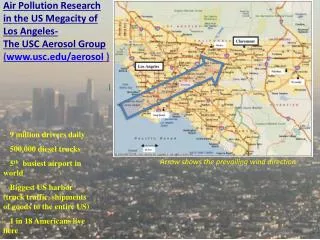
Explore the air quality of Los Angeles Basin, California, focusing on pollutants, health impacts, and transportation effects. Analyze data from 1987 to 2010, including CO, NOx, SOx, VOCs, PM2.5, and more. Learn about sensitive areas, such as near freeways, and the Weekend Effect on air quality. Discover key statistics on health issues and environmental impact. Monitor current emissions in LA compared to global levels. Utilize resources like EPA and AQMD for real-time data. Understand the local meteorology and geographical factors affecting air quality trends.

E N D
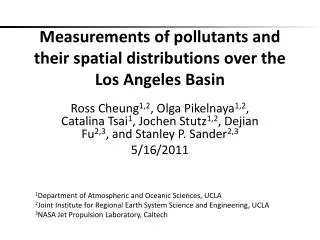
Air Quality and Transport Study ofthe Los Angeles Basin Bo Tan M.S Student Department of Atmospheric sciences University of Nevada Reno – Desert Research Institute
Tons per day (2010) 1987 • CO • NOx • SOx • Reactive Organic Gases (ROG) • Total Organic gas • PM2.5 • 486.6 • 96.7 • 15.9 • 102.7 • 218.1 • 26.3 • 9796 • 889.5 • 113.5 • 2429 http://www.arb.ca.gov/app/emsinv/fcemssumcat_query.php
Air Quality • City Smog • Industrial Emission (point source) • VOC: Volatile Organic Compounds • SOx : Sulfur oxides • [Na2CO3(s)]: soda ash • Exhaust Emission (mobile source) • CO: Carbon Monoxide • [NO2(g)]: Nitrogen oxides • [O3(g)]: Ozone
Size Distribution • Number of particles in Red • Area of particles in dashed lines • Volume of particles in dotted lines • Claremont, California, August 1987
Health Impact with PM2.5 • Sensitive Areas • Near freeway / high traffic area • Airport / harbor • Downwind from industry • Sensitive Groups • Asthma / other lung diseases • Children / Older adults • Chronicle outdoor workers
2007 Statistics • 6.5k premature death • 1.3million school absence days • 2.8million working days • 1.7 million asthma patients • 9000 hospitalized related to respiratory illness
Current LA Emissions vs. World EmissionsSOx 2002 • Data is in (ug/m^3), 150 ug/m^3 per column • In many countries, the Sulfur content is highly restricted • fuel, and power production restrictuions • Many cities stopped monitoring sulfur concentration • Bottom city Guiyang, China • Top City Nice, France
Current LA Emissions vs. World EmissionsNOx • 60 ug/m3 pre column • Bottom city Kiev Ukraine • Top city Porto, Portugal
Current LA Emissions vs. World EmissionsO3 • 200(ug/M^3) pre column • L.A O3 concentration • Riverside O3 concentration
Current Monitors • EPA • CO • NOx • SOx • O3 • PM2.5 • PM10 • Lead • Facility monitoring www.epa.gov/air/data/geosel.html • AQMD • Collaboration from multi-agencies • Local • National • forecast maps • current conditions www.airnow.gov/index.cfm?action=airnow.fcsummary
Local Meteorology • Initial stage • Initial Mixing • Development • Stabilization
Initial Stage • Stratified Atmosphere • Diminishing Land breeze • Start Valley breeze LAX ONT WHIT 8AM Time ANAH
Initial Mixing • After morning traffic • Initial sea breeze LAX ONT WHIT 12PM ANAH
Development • Marine Layer propagation • Max temperature contrast LAX ONT WHIT 3PM Time ANAH
Stabilization • Marine Layer propagation • Return Flow LAX ONT WHIT 5PM Time ANAH
Effects • Wind Speed • Soil Moisture • Temperatures
Soil Moisture NGEs: Normalized gross errors, NG: normalized biases,
Soil Moisture • Low Soil Moisture • Destabilize BL • Increase Mixing • Decrease Pollutants Concentration • High Soil Moisture • Stabilize BL • Decrease Mixing • Increase Pollutants Concentration
Soil Effect Base Simulation 15% Soil Moisture 23% Soil Moisture
Geography Hawthorne
Tons per day (2010) 1987 • CO • NOx • SOx • Reactive Organic Gases (ROG) • Total Organic gas • PM2.5 • 486.6 • 96.7 • 15.9 • 102.7 • 218.1 • 26.3 • 9796 • 889.5 • 113.5 • 2429 http://www.arb.ca.gov/app/emsinv/fcemssumcat_query.php
Summary • L.A air quality • Chemistry • Health effect • Historical trend • Compare to the world • Future projection • L.A meteorology • Dinural evolution • Effects of primary and secondary pollutants • “ The Weekend Effect”