Download
1 / 43
450 likes | 659 Vues
Renewable Energy Sources in Poland. Krzysztof Konaszewski Polish Association of Renewable Energy Zbigniew Leonowicz Wroclaw University of Technology 2010. 45%. 29%. 10%. 2%. 15%. 14%. Energy in Poland. Polska Grupa Energetyczna. Tauron - Polska Energia. Dolna Odra. PSE.

E N D
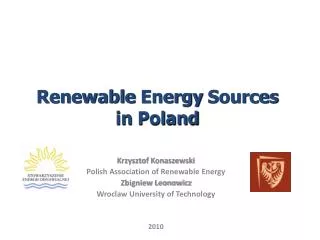
Renewable Energy Sources in Poland Krzysztof Konaszewski PolishAssociation of Renewable Energy Zbigniew Leonowicz WroclawUniversity of Technology 2010
45% 29% 10% 2% 15% 14% Energy in Poland Polska Grupa Energetyczna Tauron- Polska Energia Dolna Odra PSE 26% 17% BOT Stalowa Wola L2 PKE Energia Pro L5 + RZE Enion Grupa Energetyczna Północ-Energa Grupa Energetyczna Centrum-Enea 11 % Ostrołęka Energa Enea Kozienice KWK Bogdanka Share of the production market Share in the distribution market Source: PGE, December 2007
Installed RES power capacity MW Electrical energy production from RES GWh Source: Republic of Poland Ministry of Economy, 2008
Installed RES powercapacity 1800 Biogass Biomass 1500 Wind Water 1200 451 288 153 900 83 (MW) 600 300 0 2005 2006 2007 2008 year
Individual RES shareon the energy market (2008) • Biomass & Biogas - 12% • Wind - 34% • Large Water-Power Plants - 46% • Small Water-Power Plants - 8%
Challenges the Polish economy is facing • Energy package 3x20 – legal support for the development of renewable energy sources: • - reducing greenhouse gases emissions by 20% • - improving efficiency by 20% (reducing primary energy usage) • increasing the share of renewable energy in the energy balance by 20% • Indicative goal for Poland: • achieving 15 %* share of renewable energy sources in the country's energy balance by 2020 *) according to a proposal put forward by the European Commission from January 23, 2008
"Amount" of energy produced by the • 3x20 Package in 2020 • (according to prices and estimates from 2008) • share of the total energy market – 15% (100 TWh) • investments – approx. 40 billion EURO • annual income – approx. 10 billion EURO • (including electric energy market approx. 55 %, • heat market approx. 15 %, transport fuels market incl. Excise • approx. 30 %) • annual CO2 emissions reduction – approx. • 100 mln tons
Renewable energy demand forecast for Poland by 2020 [ TWh ] Goal option I That much RES energy should Poland produce in order to achieve its 15% share of the total production in 2020 [ 228 TWh - 2020] RES production in Poland in 2007 Goal option II That much RES energy should Poland produce in order to achieve its 15% share of the total sales in 2020 [ 160 TWh - 2020 ] - requirement counted after sales - requirement counted after production
Gross RES energy demand acc. to types of energy [ktoe]acc. to Poland's Energy Policy project by 2030 Total national electric energy demand [TWh]
Electric energy demand forecast acc. to Poland's Energy Policy by 2030 • Demand for electric energy will rise by approx. 44 % (in relation to 2006). • Gross RES electric energy production in 2020 will reach the level of approx. 31 TWh, which will be approx. 19.6 % of the total production, • Gross RES electric energy production in 2030 will reach the level of approx. 38 TWh, which will be approx. 18.4 % of the gross production. • The biggest share will belong to energy produced by wind power stations – in 2030 approx. 18 TWh (approx. 50% of all renewble sources)
Estimated RES electric energy production in Poland by 2020 Wind-power plants - 14 TWh Biomass – 16 TWh Water-power plants – 3 TWh * Acc. to the Association of Renewable Energy.
RES technical potential in Poland RES Technical Potential in Poland (TWh p.a.) Biomass • Cocombustion potential of existing plants (limiting the amount of biomasa in fuel to 8-10% for technological reasons) • Low investment cost • Necessity to transport and/or store biomass • Low caloric value of fuel • Poorly developed biomass market in Poland Wind • Production unpredictability and the necessity to maintain larger reserves for balancing • Large investment cost in MW • Relatively low efficiency • Potential resistance from environmentalists Water • Unused water potential mainly on Wisla and Odra, large resistance from the environmentalists against regulating those rivers • Large investment cost in MW The RES technical potential in Poland can be estimated at 64 -76 TWh
Renewable energy development options assessment good śaverage bad
Renewable energy sources investment needs Investments necessary to produce an average of 1 MWh a year [PLN/MWh] Low network limitations Small growth potential 2500-3100 2500-3100 Low network limitations, large growth potential, low fuel supplies limitations 1900-2400 1700-2000 PLN/ MWh No network limitations, fuel supplies limitations 600-750 250-300
RES electric energy production support mechanism • Quantitatice liability system realized in the form of "green certificates" • Functions since October 1, 2005 Obligations of companies selling energy to end buyers • Submitting Origin Certificates to the President of the Energy Regulatory Authority for remission • Paying the substitute fee Source: Republic of Poland Ministry of Economy, 2008
RES support mechanism electric energy price: 2008 2009 green certificate price: 2008 2009 substitute fee value: 2008 2009
Additional obligations • Obligation to buy the whole amount of RES electric energy at an average electric energy market price from last year • The average market price is published by the President of the Energy Regulatory Authority Source: Republic of Poland Ministry of Economy, 2008
Investment support • European Union funds for 2007-2013 • "Infrastruktura i Środowisko" Operational Program • "Innowacyjna Gospodarka" Operational Program • Rural Areas Development Program • Regional Operational Programs • National funds • National Fund for Environmental Protection and Water Management • provincial, district and communal environmental protection and water management funds Source: Republic of Poland Ministry of Economy, 2008
The future of RES electric energy in Poland • 2010 goal – 7,5 % • Performance for 2007 – 3,4 % • Performance for 2007 – 4,5 % • Forecast for 2020 – ? Source: Republic of Poland Ministry of Economy, 2008
Energy potential of Polish rivers • Poland's annual hydroenergetic resources:8.800 GWh • Poland's annual hydroenergetic resources use in 2006:2.200 GWh • Additional expected hydroenergetic resources use in the years 2008-2020:882 GWh (when considering achieving maximum effects of building water-power plant)
Water power development scenarios 1. Construction of new barrages and water-power plants, 2. Using existing damming structures to build water-power plants 3. Modernization and renowation of existing structures Hydroenergetic facilities in Poland: • pre-war MEW number: approx. 8.000 • post-war MEW number : approx. 630
Wind powerdevelopment in Poland • It is estimated, that 1/3 of the area of Poland has good wind energy potential • Installed wind-power plants power (in 2008 in Poland): 451 MW EWEA forecast for 2010: 1200 MW • possibility to connect wind-power plants to the power system with a combined power of: 5 000 MW • (no additional network investments required)
Wind energy in Poland in kWh (m2/year) • Mesoscale wind resources privellaged areas in Poland are: • Central, most forward area of the seaside, from Koszalin to Hel, • Area of the island Wolin, • Suwalszczyzna, • Central Wielkopolska and Mazowsze, • Beskid Śląski and Żywiecki, • Bieszczady and Pogórze Dynowskie. Sources: http://www.elektrownie-wiatrowe.org.pl and Europejskie Centrum Energii Odnawialnej and "Nowy Przemysł" based on EWEA
Network barriers • Poor network infrastructure in Poland, especially in areas favorable to wind. • Network development problems (ownership of land). • Connection costs. • Increased demand for storing reserve power Administration Barriers • Construction Law regulation requirements. • Large amount of agreements (scattered investment). • Necessity to obtain public goal decisions . • Necessity for Local Plan changes. • Long duration of formal procedures. Source: ESP S.A., 2007
Biomass sources Biomass Solid Biomass Fluid & Semi-fluid Biomass Gas Biomass • forests, gardens and urban green areas biomass • forest and paper industry waste • food industry waste • straw and other agricultural waste • special energy crops • sewage treatment plant sedimentation waste • animal feaces • landfill gas and agrigas • sewage treatment plant biogas
Biomass & Biogas combustion technology * According to study by the Association of Renewable Energy: "Analiza polskiego potencjału rozwojowego w obszarze energetyki odnawialnej, z punktu widzenia możliwości wypełnienia przez Polskę celów unijnego pakietu energetycznego 3x20"
Energy crops Energy cropsare plant crops for acquiringbiomass for energy purposes. Energy cropsareused for producingheat, electric energy and gas fuel (biogas). Energy cropsarethose, that do not producefood.
Polish energy farming potential Annual primary energy consumption in Poland in 2007: 4.000 PJ • Technical potential of biomass technologies: • 685 PJ * (190.000 GWh a year) • Potential of biomass technologies, considering active support from the government: • 2440-2840 PJ ** (676.000-787.000 GWh a year) * According to ECBREC data ** According to study by the Association of Renewable Energy and Politechnika Śląska: "Analiza polskiego potencjału rozwojowego w obszarze energetyki odnawialnej, z punktu widzenia możliwości wypełnienia przez Polskę celów unijnego pakietu energetycznego 3x20"
Agrienergetics development Scattered biogas power industry Biomass approx. 6000 ha (average for 1 sugar factory) approx. 0.08 TWh from biogas and 0.03 TWh for cocombustion Sugar factory Cocombustion
Biogas-works construction problems • Biogass production technology is not yet fully explored; • Technology import is very expensive; • Complex pemrission acquisition procedures; • Small public knowlegde about renewable energy sources; • Lack of local acceptance for biogas-works; • Expensive technology. Investment requires additional capital; • Selling heat is a problem in many of the country's regions;
Support for agrienergetics • Government biogas technology development Programs • Bonus for planting energy crops (45 €/ha) • In 2007 Farmlands Payment and Sugar Payment Act (Dz. U. z 26 stycznia 2007r. Nr 35, poz. 217, z późn. zm.), • allows energy crops producers to receive a surcharge of 45 euro/ha • increased interest in production from farmers of energy crops • relatively small amount of manufacturers ready to sign long-lasting contract agreements with the farmers. • Actions initiated by Chambers of Commerce and Associations
Geothermal sources' energy annual technical potential in Poland
Solar energy resources in Poland (1) Solar radiation energy usage in flat-plate collectors The most essential parameters are the annual insolation values. (Annual solar radiation density in Poland per horizontal plane is between 950-1250 kWh/m2, average insolation is 1600 h/year) Source: Agencja Rynku Energii SA Pic. 1. Zoning of average annual solar radiation sums per horizontal plane unit in kWh/m2/year. Values indicate total annual solar radiation energy resources for the given region.
Solar energy resources in Poland (2) Average annual solar radiation sums Poland's sun batteries economic potential for usable hot water production is 24 PJ Sun batteries potential for drying crops is 21 PJ Source: Agencja Rynku Energii SA Pic. 2. Average annual insolation sums, h/year for Poland's representative regions.
Solar energy conditions in Poland • Weather conditions in Poland are characterized by uneven annual solar radiation distribution: - 80% of the total annual insolation sum falls on 6 months - Suns' activity during winter is shortened to only 8 h/day, and in summer it is 16 h • Scattered radiation share in the total radiation - above 50% annualy - during the four months of winter – 65-73% • Annual solar radiation density per horizontal plane is approx. 950-1250 kWh/m2 • Poland's average annual insulation sums are 1600 h
Technology development barriers • uneven annual solar radiation distribution, especially during winter • large investments and manufacturing costs • no specified technology development trends • lack of knowledge and experience necessary to prepare the projects • negative attitude of banks towards financing (projects too small)
Government plans for the development of the energy sector • Government plans specified in: "Założenia Polityki Energetycznej Polski do roku 2030" • Strategic goals: • increasing the share of energy from renewable sources in the country's fuel-energy balance to 7.5% in 2010 • increasing the share of energy from renewable sources to 15% in 2020 in the primary carriers usage structure • Achieving the abovementioned means the necessity to perform a series of investments
Increase of RES share inthe energy balancemeans: • Increased energy resources usage effectiveness, • Better environment condition thanks to the reduction of pollutant emissions to the atmosphere and water and waste production, • Increased energetic security, • Elicitation and usage of the full agricultural potential in Poland.
RES Status in 2010 • The share of renewable energy in gross national electricity consumption was at the end of 20095,5% instead of 7,5% • all sources of OZE generated approx. 8.6 TWh of electricity, while gross electricity consumption at the level of the 149 TWh • very serious concern that the objective in the field of renewable energy development • 2,5 TWh of electricity from RES ismissing
Status 2010 • most of the energy from OZE comes from large power system using a co-combustion of biomass with coal in power stations and power gives the system currently in Poland, 4,2 TWh. • hydroelectricity provide 2.4 TWh, wind production is 1 TWh of electricity, • the rest of the renewable energy comes from the combustion of biomass and biogas in industrial plants and small sources.
Future until 2020 • From 1 January 2011, Poland begins to pursue the objective of 15% share of renewable energy sources in total primary energy in 2020. • Directive 2009/28/EC -national plan of action in the field of renewable energy sources (NAPS) • first verification of the progress in 2012.
Renewable Energy Association www.seo.org.pl