Download

1 / 93
940 likes | 1.11k Vues
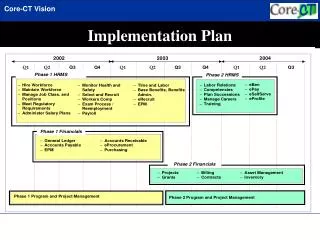
State Implementation Plan (SIP) Modeling for 8-hour Ozone Preliminary 2009 Results For Triangle and Rocky Mount Stakeholders. Mike Abraczinskas, NCDAQ Laura Boothe, NCDAQ George Bridgers, NCDAQ Bebhinn Do, NCDAQ July 13, 2005. Preface.

E N D
State Implementation Plan (SIP) Modeling for 8-hour OzonePreliminary 2009 ResultsFor Triangle and Rocky Mount Stakeholders Mike Abraczinskas, NCDAQ Laura Boothe, NCDAQ George Bridgers, NCDAQ Bebhinn Do, NCDAQ July 13, 2005
Preface • 2008 emissions inventories are being developed by NCDAQ for the Triangle and Rocky Mount nonattainment areas • Preliminary 2008 emissions and air quality modeling to be performed by NCDAQ !!! 2009 emissions and air quality modeling results are being presented here today as a surrogate for 2008 !!!
Outline • Review / Background • Typical 2002 and Future 2009 emissions • Attainment test – How does it work? • Attainment test – Preliminary Results • Next steps • Emissions changes anticipated in next set of modeling (2002 & 2008)
Background • 8-hour ozone standard • If a monitored design value is > 0.08 ppm (84 ppb), that monitor is violating the standard • The design value is defined as: • 3-year average of the annual 4th highest daily maximum 8-hour average
Ozone Nonattainment TimelineDefinitions for Triangle and RMT Areas June 15, 2004 June 15, 2005 June 15, 2007 June 15, 2009* 2006-2008 2008 2005 or 2006 TBD Effective date = Transportation conformity date = SIP submittal date = Attainment date = Data used to determine attainment = (Modeling) Attainment year = Redesignation base years = Maintenance years = * Or as early as possible
What if area attains prior to SIP submittal date? Redesignation/Maintenance SIP
Redesignation/Maintenance SIPProcess Overview • Area attains standard (2005 or 2006) • Develop emissions inventory for the year area attains standard • Develop maintenance emissions inventories for at least 10 years beyond redesignation approval • Determined through Inter-Agency Consultation Process • Develop interim/maintenance emissions inventories • 3 to 5 year increments • Compare maintenance emissions to attaining year’s emissions • Maintenance emissions must be lower than attaining year’s emissions… If not, control strategies must be developed
Redesignation/Maintenance SIPProcess Overview • Develop draft SIP package • Emissions comparisons • Motor Vehicle Emissions Budgets • Contingency measures • Take draft SIP to public hearing • 30 day comment period • Submit to EPA anytime prior to June 2007 • Update plan 8 years after redesignation • Must examine additional 10 years beyond final maintenance year in redesignation package
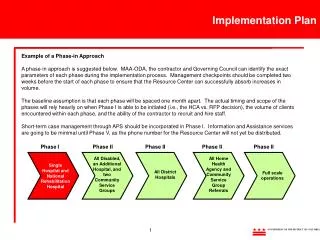
Modeling Application Process • Select areas or domains of interest • Select representative ozone season/episodes • Prepare and refine meteorological simulations • Prepare and refine emission model inputs • Apply air quality modeling system • Performance evaluation of air quality modeling system • Prepare current and future year emissions • Re-apply air quality modeling system • Apply the attainment test May 31st Today
Modeling Domains 12 km 36 km
Modeling Season / Episode • Full Year of 2002 selected for VISTAS modeling • Regional Haze / Fine Particulate: Full Year • Ozone: Late May – End Of August • This is the portion of the 2002 ozone season when the majority of ozone exceendances took place.
SparseMatrixOperatorKernelEmissions Emissions Processor Meteorological Model SMOKE MM5 Community Multiscale Air Quality System Air Quality Model CMAQ Temporally and Spatially Gridded Air Quality Output predictions Air Quality Modeling System
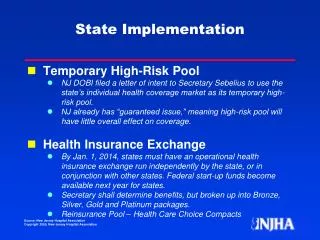
State Implementation Plan (SIP) • Need a “SIP submittal” to EPA within three years • Attainment Demonstration that details the State’s plan to bring the area into attainment of the Federal standard • Triangle and RMT areas…must include: • Reasonably Available Control Measures (RACM) • Reasonable Further Progress (RFP)
Requirements • RACM Requirements • Applies to all source sectors (point, area, highway mobile & off-road mobile sources) • Point Sources referred to as RACT (Reasonably Available Control Technology) • Only what is necessary to attain NAAQS as expeditiously as practicable • NC has already adopted some RACM type rules • Open burning ban during ozone events • Expanded I/M program • Pre-adopted VOC and NOx RACT rules for the 1-hour ozone nonattainment areas
2002 Typical and 2009 Emissions Overview Mike Abraczinskas, NCDAQ Environmental Engineer II Note !!! • 2008 emissions inventories are being developed by NCDAQ for the Triangle and Rocky Mount nonattainment areas • Preliminary 2008 emissions and air quality modeling to be performed by NCDAQ !!! 2009 emissions and air quality modeling results are being presented here today as a surrogate for 2008 !!!
Emissions Inventory Definitions • Actual = the emissions inventory developed to simulate what happened in 2002 • Typical = the emissions inventory developed to characterize the “current” (2002) emissions… It doesn’t include specific events, but rather averages or typical conditions (e.g. EGUs and fires) • Future = the emissions inventory developed to simulate the future (e.g. 2008 for Triangle and Rocky Mount modeling) ***Remember… Actual is used for model performance evaluation only! Typical and Future are used to determine future attainment status.
Preliminary 2002 Typical & 2009Emissions Comparison North Carolina Statewide NOx Emissions
Preliminary 2002 Typical & 2009Emissions Comparison North Carolina Statewide NOx Emissions Triangle Area Includes: Chatham, Durham, Franklin, Granville, Johnston, Orange, Person, Wake
Preliminary 2002 Typical & 2009Emissions Comparison North Carolina Statewide NOx Emissions Rocky Mount Area Includes: Edgecombe and Nash
2002 Typical and 2009 Emission Summaries • Point • Area & Nonroad • Mobile Triangle and Rocky Mount nonattainment areas • NOx bar charts
Chatham County 2002 VMT 2009 VMT 2002 NOx emissions = 7.1 tpd 2009 NOx emissions = 5.0 tpd
Durham County 2009 VMT 2002 VMT 2002 NOx emissions = 24.2 tpd 2009 NOx emissions = 14.3 tpd
Franklin County 2002 VMT 2009 VMT 2002 NOx emissions = 5.3 tpd 2009 NOx emissions = 3.4 tpd
Granville County 2002 VMT 2009 VMT 2009 NOx emissions = 5.4 tpd 2002 NOx emissions = 11.8 tpd
Johnston County 2002 VMT 2009 VMT 2002 NOx emissions = 34.8 tpd 2009 NOx emissions = 20.5 tpd
Orange County 2002 VMT 2009 VMT 2002 NOx emissions = 21.8 tpd 2009 NOx emissions = 9.9 tpd
Person County 2002 VMT 2009 VMT 2009 NOx emissions = 1.5 tpd 2002 NOx emissions = 2.9 tpd
Wake County 2002 VMT 2009 VMT 2002 NOx emissions = 71.3 tpd 2009 NOx emissions = 38.6 tpd
Edgdcombe County 2002 VMT 2009 VMT 2002 NOx emissions = 7.0 tpd 2009 NOx emissions = 1.8 tpd
Nash County 2002 VMT 2009 VMT 2002 NOx emissions = 19.5 tpd 2009 NOx emissions = 11.2 tpd
ONROAD Mobile NOx 2009 minus 2002 (max difference) • Reductions only • Scale 0 to –0.5 moles/s
Triangle* NOx emissions * Triangle Area Includes: Chatham, Durham, Franklin, Granville, Johnston, Orange, Person, Wake
Rocky Mount* NOx emissions * Rocky Mount Area Includes: Edgecombe and Nash Counties
Air Quality Modeling Results • Bebhinn Do, NCDAQ Meteorologist
What is a Modeled Attainment Demonstration? • Analyses which estimate whether selected emissions reductions will result in ambient concentrations will meet NAAQS • An identified set of control measures which will result in the required emissions reductions • Use the ModeledAttainment Test to estimate emissions reduction needed to demonstrate attainment
What is the Attainment Test ? • An exercise in which an air quality model is used to simulate current and future air quality near each monitoring site. • Model estimates are used in a “relative” rather than “absolute” sense. • Future ozone design values are estimated at existing monitoring sites by multiplying a modeled relative reduction factor at locations “near” each monitor times the observed monitor-specific ozone design value. • The resulting projected site-specific “future design value” is compared to NAAQS. • If all such future site-specific design values are 84 ppb, the test is passed.
Attainment Test • DVF = RRF * DVC • DVF = Future Design Value • RRF = Relative Reduction Factor • DVC = Current Design Value
Attainment Test DVC is based on observed data DVF = RRF * DVC RRF is based on modeled data Future modeled values Current modeled values If DVF is 84 ppb, the test is passed.
Attainment Test • Step 1: Compute a current site-specific design value (DVC) from monitored data • Step 2: Use air quality modeling results to estimate a site-specific relative reduction factor (RRF) • Step 3: Multiply the relative reduction factor obtained in step 2 times the site-specific design value in step 1… The result is a predicted site-specific future design value (DVF)… • If DVF is 84 ppb, the test is passed.DVF = RRF* DVC
Attainment Test Step 1: Compute the current design value (DVC) • The DVC is calculated for each monitoring site within a nonattainment area. • EPA Draft Final Guidance for the 8-hour Ozone standard suggests a few possible methods for calculating the DVC.