Testing a Claim
Testing a Claim. Chapter 9 notes. 9.1 - Significance Tests: The Basics. Example:

Testing a Claim
E N D
Presentation Transcript
Testing a Claim Chapter 9 notes
9.1 - Significance Tests: The Basics • Example: • According to an article in the San Gabriel Valley Tribune (February 13, 2003), “Most people are kissing the ‘right way’.” That is, according to the study, the majority of couples tilt their heads to the right when kissing. In the study, a researcher observed 124 couples kissing in various public places and found that 83/124 (p-hat =0.669) of the couples tilted to the right when kissing. Is this convincing evidence that the true proportion p of all couples that kiss the right way is greater than 0.50? • Give two explanations for why the sample proportion was above 0.50. • 1. • 2. • How can we decide which of the two explanations is more plausible?
Read p. 529 - 530 • What is the basic idea of a significance test? • Stating Hypotheses • Read p. 531 – 532 • What is the difference between a null and an alternative hypothesis? What notation is used for each? • What are some common mistakes when stating hypotheses? • What is the difference between a one-sided and a two-sided alternative hypothesis? How can you decide • which to use?
Example: • Mike is an avid golfer who would like to improve his play. A friend suggests getting new clubs and lets Mike try out his 7-iron. Based on years of experience, Mike has established that the mean distance that balls travel when hit with his old 7-iron is μ = 175 yards with a standard deviation of σ = 15 yards. He is hoping that his new club will make his shots with a 7-iron more consistent (less variable), and so he goes to the driving range and hits 50 shots with the new 7-iron. • (a) Describe the parameter of interest in this setting. • (b) State appropriate hypotheses for performing a significance test.
Check Your Understanding (p. 532): • 1. • 2.
Interpreting P-Values • Read p. 533 – 534 • What is a P-value? What does a P-value measure? • In the kissing example, the P-value = P( 0.669 | p = 0.5) = ______. Interpret this value. • Example: • When Mike was testing a new 7-iron, the hypotheses were Ha : = 15 versus • H0 : σ < 15 where σ = the true standard deviation of the distances Mike hits golf balls using the new 7-iron. Based on 50 shots • with the new 7-iron, the standard deviation was sx = 10.9 yards. A significance test using the sample • data produced a P-value of 0.002. • Interpret the P-value in this context. • (b) Do the data provide convincing evidence against the null hypothesis? Explain.
Statistical SignificanceRead p. 534 - 537 • What are the two possible conclusions for a significance test? • What are some common errors that students make in their conclusions? • What is a significance level? When are the results of a study statistically significant?
Example: • For his second semester project in AP Statistics, Zenon decided to investigate whether students at his school prefer name-brand potato chips to generic potato chips. He randomly selected 50 students and had each student try both types of chips, in random order. Overall, 34 of the 50 students preferred the name-brand chips. Zenon performed a significance test using the hypotheses • H0 : p = 0.5 versus Ha : p > 0.5 where p = the true proportion of students at his school who prefer name-brand chips. The resulting P-value was 0.0055. What conclusion would you make at each of the following significance levels? • (a) = 0.01 (b) = 0.001 • What should be considered when choosing a significance level?
Type I and Type II Errors • Read p. 538 – 542 • In a jury trial, what two errors could a jury make? • They could give a guilty verdict when not guilty • They could say not guilty when they are guilty • In a significance test, what two errors can we make? Which error is worse? • We could reject H0 but should have failed to reject • We could fail to reject Ho when we should have rejected. Type I error Type II error
Example: • The manager of a fast-food restaurant want to reduce the proportion of drive-through customers who have to wait more than two minutes to receive their food once their order is placed. Based on store • records, the proportion of customers who had to wait at least two minutes was p = 0.63. To reduce this proportion, the manager assigns an additional employee to assist with drive-through orders. During the next month the manager will collect a random sample of drive-through times and test the following hypotheses :Ho : p = 0.63 versus Ha : p < 0.63 where p = the true proportion of drive-through customers who have to wait more than two minutes after their order is placed to receive their food. Describe a Type I and a Type II error in this setting and explain the consequences of each. • Type I: He thinks the proportion of customers who have to wait has decreased when it actually hasn’t. • Type II: He thinks the proportion of customers who have to wait has not decreased when it actually has.
Check Your Understanding (p. 539): • 1. • 2. • 3.
What is the probability of a Type I error? What can we do to reduce the probability of a Type I error? Are there any drawbacks to this? • P(Type I) = • It is the probability of rejecting H when it is really true. • What is the power of a test? How is power related to the probability of a Type II error? Will you be expected to calculate the power of a test on the AP exam?
Planning Studies: The Power of a Statistical Test • Read p. 542 - 545 • What four factors affect the power of a test? Why does this matter? Applets: http://www.intuitor.com/statistics/CurveApplet.html http://wise.cgu.edu/powermod/power_applet.asp http://whfreeman.org/tps4e
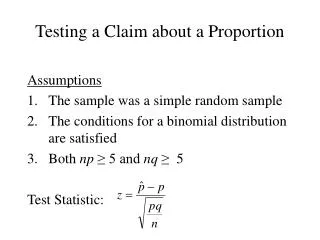
9.2 - Significance Tests for a Population Proportion • Carrying out a Significance Test • Read p. 549 - 552 • What are the three conditions for conducting a significance test for a population proportion? How are these different than the conditions for constructing a confidence interval for a population proportion? • What is a test statistic? What does it measure?
Example: • Let’s revisit Jack’s campaign for mayor. Jack needs 50% of the votes in order to win the election. In an SRS of 100 voters, 56 favored Jack. • (a) Check the conditions for carrying out a significance test to determine whether Jack should feel confident of victory in the mayoral election. • (b) Calculate the test statistic. • (c) Find and interpret the P-value.
The One-Sample Z Test for a Proportion! • Read p. 552 - 556 • What are the four steps for conducting a significance test? What is required in each step? • What test statistic is used when testing for a population proportion? Is this on the formula sheet? • What happens when the data doesn’t support ? • Can you use your calculator for the Do step? Are there any drawbacks to this method?
Example: • On shows like American Idol, contestants often wonder if there is an advantage to performing last. To investigate this, a random sample of 600 American Idol fans is selected, and they are shown the audition tapes of 12 never-before-seen contestants. For each fan, the order of the 12 videos is randomly determined. Thus, if the order of performance doesn’t matter, we would expect approximately 1/12 of the fans to prefer the last contestant they view. In this study, 59 of the 600 fans preferred the last contestant they viewed. Does these data provide convincing evidence that there is an advantage to going last?
Two-Sided Tests • Read p.556 - 558 • Example: • When the accounting firm AJL and Associates audits a company’s financial records for fraud, they often use a test based on Benford’s law. Benford’s law states that the distribution of first digits in many reallife sources of data is not uniform. In fact, when there is no fraud, about 30.1% of the numbers in financial records begin with the digit 1. However, if the proportion of first digits that are 1 is significantly • different from 0.301 in a random sample of records, AJL and Associates does a much more thorough investigation of the company. Suppose that a random sample of 300 expenses from a company’s financial records results in only 68 expenses that begin with the digit 1. Should AJL and Associates do a more thorough investigation of this company?
Why Confidence Intervals Give More Information • Read p. 558 - 561 • Can you use confidence intervals to decide between two hypotheses? • What is an advantage to using confidence intervals for this purpose? • Why don’t we always use confidence intervals?
Example: • (a) Find and interpret a confidence interval for the true proportion of expenses that begin with the digit 1 for the company in the previous Example. • (b) Use your interval from (a) to decide whether this company should be investigated for fraud.
9.3 - Tests about a Population Mean • Carrying Out a Significance Test for μ • Read p. 565 - 570 • What are the three conditions for conducting a significance test for a population mean?
Example: • A classic rock radio station claims to play an average of 50 minutes of music every hour. However, it seems that every time you turn to this station, there is a commercial playing. To investigate their claim, you randomly select 12 different hours during the next week and record what the radio station plays in each of the 12 hours. Here are the number of minutes of music in each of these hours: • 44 49 45 51 49 53 49 44 47 50 46 48 • Check the conditions for carrying out a significance test of the company’s claim that it plays an average of 50 minutes of music per hour.
What test statistic do we use when testing a population mean? Is the formula on the formula sheet? • How do you calculate P-values using the t distributions?
Example: • (a) Find the P-value for the Less Music example • (b) Find the P-value for a test ofH0 : μ = 10 versus Ha : > 10 that uses a sample of size 75 and has a test statistic of t = 2.33. • (c) Find the P-value for a test of H0 : μ = 10 versus Ha : μ≠ 10 that uses a sample of size 10 and has a test statistic of t = −0.51.
Check Your Understanding (p. 570): • 1. • 2. • 3.
The One-Sample t Test • Read p. 570 - 573 • Example: • Every road has one at some point—construction zones that have much lower speed limits. To see if drivers obey these lower speed limits, a police officer used a radar gun to measure the speed (in miles per hour, or mph) of a random sample of 10 drivers in a 25 mph construction zone. Here are the results: • 27 33 32 21 30 30 29 25 27 34 • (a) Can we conclude that the average speed of drivers in this construction zone is greater than the posted 25 • mph speed limit? • (b) Given your conclusion in part (a), which kind of mistake—a Type I or a Type II error—could you have • made? Explain what this mistake means in this context.
Two-Sided Tests and Confidence Intervals • Read p. 574 - 577 • Example: • In the children’s game Don’t Break the Ice, small plastic ice cubes are • squeezed into a square frame. Each child takes turns tapping out a cube of • “ice” with a plastic hammer, hoping that the remaining cubes don’t collapse. • For the game to work correctly, the cubes must be big enough so that they • hold each other in place in the plastic frame but not so big that they are too • difficult to tap out. The machine that produces the plastic cubes is designed • to make cubes that are 29.5 millimeters (mm) wide, but the actual width • varies a little. To ensure that the machine is working well, a supervisor • inspects a random sample of 50 cubes every hour and measures their width. • The Fathom output summarizes the data from a sample taken during one • hour.
(a) Interpret the standard deviation and the standard error provided by the computer output. • (b) Do these data give convincing evidence that the mean width of cubes produced this hour is not 29.5 mm? Use a significance test with a = 0.05 to find out. • (c) Calculate a 95% confidence interval for μ. Does your interval support your decision from part (b)?
Inference for Means: Paired Data • Read p. 577 - 581 • Example: • For their second semester project in AP Statistics, Libby and • Kathryn decided to investigate which line was faster in the • supermarket: the express lane or the regular lane. To collect their • data, they randomly selected 15 times during a week, went to the • same store, and bought the same item. However, one of them used • the express lane and the other used a regular lane. To decide • which lane each of them would use, they flipped a coin. If it was • heads, Libby used the express lane and Kathryn used the regular • lane. If it was tails, Libby used the regular lane and Kathryn used • the express lane. They entered their randomly assigned lanes at • the same time, and each recorded the time in seconds it took them • to complete the transaction. Carry out a test to see if there is • convincing evidence that the express lane is faster.
Example: • A friend of yours claims that he can control the roll of a die, increasing his probability of rolling a six. You decide to put him to the test and ask him to roll a fair die 50 times. Of the 50 rolls, 11 are sixes. Does this provide convincing evidence that your friend can increase his probability of rolling a six? • State the hypotheses you are interested in testing. • (b) Verify that the conditions for a one-sample z test for p are not satisfied in this case. • Using Tests Wisely • Read p. 581 – 585
(c) Using the appropriate binomial distribution, calculate the probability of getting 11 or more sixes in 50 rolls when the probability of rolling a six is 1/6. • (d) Based on your calculation in part (c), what conclusion would you draw about the hypotheses in part (a)? Use a significance level of 0.01.
(e) Using a significance level of 0.01, how many sixes would your friend need to roll to convince you that he can increase the probability of rolling a six? Explain how you obtained your answer. • (f) Suppose that your friend can actually control the die to some extent, giving him a 25% probability of rolling a six. In 50 rolls, what is the probability that you don’t find convincing evidence of his skill? • Why do you think this probability is so large?