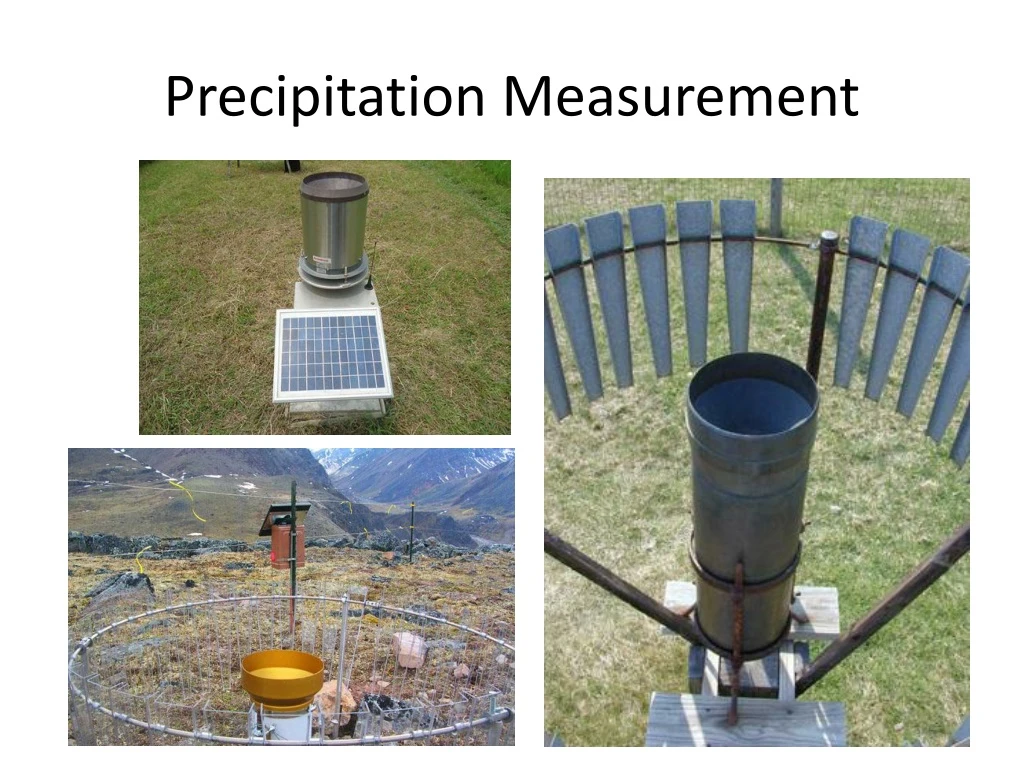
Precipitation Measurement and Analysis for Hydrology Studies
230 likes | 284 Vues
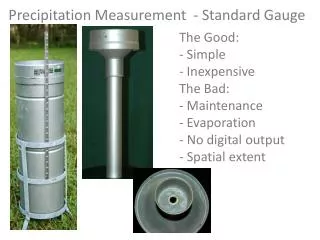
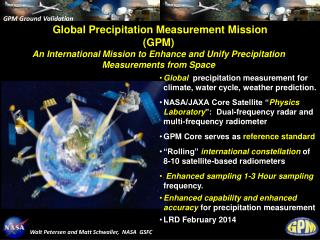
Learn about precipitation terminology, frequency analysis, water budget in a watershed, surface runoff, infiltration, unit hydrographs, and hydrologic response for effective hydrology studies.

Precipitation Measurement and Analysis for Hydrology Studies
E N D
Presentation Transcript
Area Average Precipitation From Mays, 2011, Ground and Surface Water Hydrology
NOAA Hydrometeorological Design Studies CenterPrecipitation Frequency Data Server (PFDS) http://hdsc.nws.noaa.gov/hdsc/pfds/ The standard source for design storm data CEE 3430 – Spring 2011
Terminology used in Precipitation Frequency Analysis D = i Td • Duration (Td). The interval over which precipitation occurs. • Intensity (i). The average precipitation rate over a specified duration • Depth (D). The total precipitation over a specified duration • Exceedanceprobability (P). The probability associated with exceeding a given amount in any given period (usually year) once or more than once. • Recurrence interval or Return period (T). The average interval between events of a set magnitude, evaluated as the inverse of the exceedenceprobability • A 50 year return period event has a 1/50 = 0.02 probability of being exceeded in any one year • Frequency. General term for specifying the average recurrence interval or annual exceedanceprobability. Rate i Time Td • Annual maximum series (AMS). Time series of the largest amounts in a continuous period (usually year). • Partial duration series (PDS). Time series that includes all amounts above a pre-defined threshold regardless of year; it can include more than one event in any particular year. Based on http://www.nws.noaa.gov/oh/hdsc/glossary.html
Water Budget in a Watershed From Mays, 2011, Ground and Surface Water Hydrology
Evaporation • Calculate Evaporation by • Energy balance (p304) • Aerodynamic method • (p307) • Combined method • (p309) • Priestley-Taylor method • (p309)
Method Information Requirements Aerodynamic Energy Balance RN Combination
+ + RN - - - + Summary • Energy exchanges and energy balance • Turbulent diffusion into the atmosphere • Adjustment and balance Conditions adjust to varying inputs. Calculations can interpret measurement, but should not be used to predict the effect of changing one variable without considering the adjustments of connected variables
Surface Runoff occurs when surface water input exceeds infiltration capacity. (a) Infiltration rate = rainfall rate which is less than infiltration capacity. (b) Runoff rate = Rainfall intensity – Infiltration capacity. (from Dunne and Leopold, 1978)
Green-Ampt model idealization of wetting front penetration into a soil profile • for ho = 0 From Mays, 2011, Ground and Surface Water Hydrology
Example Consider a watershed with XXX soil and Green-Ampt parameters given in Mays Table 7.4.1 (page 317). Consider a storm where X cm of rainfall occurs in X hours. Calculate the following using the Green-Ampt approach. a) Time to ponding b) Depth of infiltration excess runoff generated from this storm
Unit hydrographs • The unit hydrograph reflects the unchanging characteristics of a watershed that relates excess precipitation to direct runoff. • U(t) is the response to 1 unit of precipitation over a watershed in duration D. • Direct application. Given U(t) and P(t) calculate Q(t) (8.3.1, 8.3.2) • Inverse application. Given P(t) and Q(t) deduce U(t) for use with different P(t) inputs (8.3.2, 8.3.1) • Deduce losses and excess precipitation – CN, index (8.2.1, 8.7.2, 8.2.6, 8.7.1, 8.7.3, 8.7.5) • Synthetic unit hydrograph. Determine U(t) from watershed attributes (8.4.1, 8.8.1, 8.4.1, #6, 8.8.1, 8.8.2) • S-Hydrograph. Technique to change the duration D associated with a unit hydrograph (8.5.1, 8.3.6, 8.5.4) ExampleHW Problem
Synthetic Unit Hydrographs • A unit hydrograph is intended to quantify the unchanging characteristics of the watershed • The synthetic unit hydrograph approach quantifies the unit hydrograph from watershed attributes 1/3 2/3 Follow the procedure of table 8.4.1 • Widths (4.05,570) (3.09,427.5) (5.97,427.5) W75 (7.41,285) W50 1/3 2/3 (14.1,0)
Effective Precipitation from the SCS Curve Number Equation From Mays, 2011, Ground and Surface Water Hydrology
Hydrologic Response from the unit Hydrograph Excess Precipitation Precipitation Infiltration Capacity Excess Precipitation Time
Calculating a Hydrograph from a Unit Hydrograph and visa versa ... ... for n=1 ... N From Mays, 2011, Ground and Surface Water Hydrology
Baseflow separation and hydrograph recession Direct Runoff Baseflow End of direct runoff and beginning of baseflow recession
Rainfall – Runoff Analysis From Mays, 2011, Ground and Surface Water Hydrology
S Curve to change the duration associated with a unit hydrograph