Download
1 / 62
750 likes | 1.63k Vues
Measurement of Precipitation Using Rain Gauges. Jennifer Adam Department of Civil and Environmental Engineering University of Washington. Overview. Precipitation Gauges Types Used Gauge Networks in USA and Canada Undercatch of Precipitation using Gauges

E N D
Measurement of Precipitation Using Rain Gauges Jennifer Adam Department of Civil and Environmental Engineering University of Washington
Overview • Precipitation Gauges • Types Used • Gauge Networks in USA and Canada • Undercatch of Precipitation using Gauges • Other Problems with Gauge-Measured Precipitation • World Meteorological Precipitation Gauge Intercomparisons • Available Precipitation Data Sets • Station Data • Gridded Data
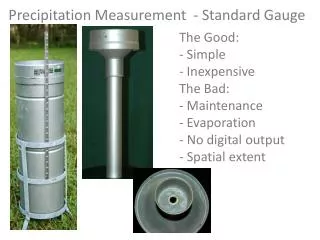
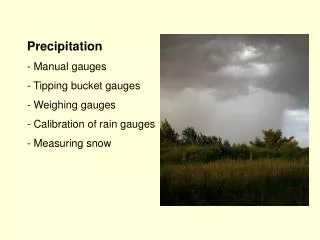
Precipitation Gauges • Non-Recording Gauges: Manually Observed • For 24-hour collection, a standard rain gauge is typically used. This is a hollow metal tube with an open top that collects precipitation. The observer uses a ruler to measure the depth of the water in a small inner tube. In the winter, the small tube is taken out, and snow falls directly into the large tube. Then, snow is melted down and poured into the small tube to be measured.
Precipitation Gauges • Recording Gauges: • Tipping Bucket: Automatically tips when a certain amount of precipitation accumulates inside of it. Total precipitation is determined by the number of tips. • Weighing Gauge: Tall and typically cone-shaped. It collects all types of precipitation continuously into a bucket. Its weight presses down on a scale, and every 15 minutes, a hole is punched in a ticker tape or a marking is made on paper by pen to record the bucket's weight. This is useful for hourly collections. • Optical Gauge: Measures precipitation rate proportional to a disturbance to a beam between a light-emitting diode and a sensor.
Precipitation Gauges of the World • ~50 types of National Standard gauges (Sevruk et al., 1989)
Shielded Nipher Gauge • Used in Canada for Solid Precipitation • Small errors
Hellmann Gauge • Various Designs: German, Polish, Danish, Hungarian • Standard in 30 countries: used 30,000 locations world-wide Yugoslav Standard Dannish Standard German Unshielded Nipher-Shielded
Shielded Tretyakov Gauge • Former USSR countries, North Korea, Mongolia, Finland
SMHI Gauge • Sweden • Norway
Finnish Standard Gauges 1908-1981: Wild 1982-1991: Wild
Japanese Standard Gauges Unshielded Tipping Bucket – mostly in South Shielded and Heated Tipping Bucket – mostly in North
The Canadian Network • Unique Precipitation Gauge Network • Liquid Precipitation: AES Type B • non-recording gauge • as of mid 1970’s • at ~2500 AES stations • Solid Precipitation: ~560 Nipher Gauges ~1800 Snow Ruler Stations (assume a density of 100 kg/m3)
The US Network • National Standard since 1870 (inception of NWS): the NWS 8” non-recording gauge • ~7,500 locations in US (~1,340 elsewhere) • 1940: Alter Shield Introduced – currently about 200 shielded gauges (Western US) • Unshielded gauge has large wind-induced undercatch
US Recording Gauges • ~3,000 Recording gauges used in the US • Tipping Bucket Gauge • Weighing Gauge • Fischer and Porter Gauge (also a type of weighing gauge) – gradually replacing WG as predominate rain gauge since 1963. • These gauges tend to have more undercatch than the 8” gauge (especially the TB)
National Weather Service • 278 primary stations (1st order) • Mainly at airports • Staffed on 24-hr basis by paid employees • Hourly precipitation measured at 241 stations, the rest are daily • 8000 cooperative stations • Staffed mainly by volunteers • Hourly precipitation measured at ~2600 stations, the rest are daily
Automated Surface Observing System (ASOS) • Introduced in 1990’s, joint program of NWS, FAA, and DOD • Serves as nation’s primary surface observing network – used at essentially all US sites on the GTS • Primarily located at airports • >600 ASOS stations in the US, increasing number every year • Observations include temperature, pressure, wind speed, and precipitation accumulation
ASOS Heated Tipping Bucket (HTB) Gauge • The HTB is replacing many of the standard 8” gauges • Increased Inhomogeneity in time and space • Mid 1990’s is period of greatest change
Problems with US Network • Gauge Type and Shielding Inhomogeneous in time and space • Trend towards Recording Gauges • Relocations frequently occur • 1st order stations located mainly at airports • Inhomogeneous in gauge density: low gauge density in Western US and mountainous areas – difficult to support higher resolution gridding • The unshielded 8” has large wind-induced undercatch, especially for solid precip
Undercatch of Precipitation Using Standard Gauges Sevruk, 1982
Wind-Induced Undercatch • Influencing Factors: • Wind speed • Temperature • Gauge type • Gauge height • Windshield • Exposure Nespor and Sevruk, 1999
Wetting Losses • Influencing Factors: • Gauge type • Climate • Measurement Methodology
Evaporation Losses • Influencing Factors: • Gauge type • Climate • Measurement Methodology
Other Sources of Errors • Obstruction (ideally in a clearing surrounded by trees) • Occult Precipitation: fog drip and rime • Observer Errors: random, systematic, and gross • Errors due to differences in observation time (ideally midnight) • Instrument Malfunction • Specific to Recording Gauges – bad calibration… • Tampering / Vandalism • Observation Record Inhomogeneity – changes in instrumentation, site, and local environment
World Meteorological Organization (WMO) Precipitation Measurement Intercomparisons • 1960 through 1975: 1st Intercomparison • 1972 through 1976: 2nd Intercomparison – Liquid Precipitation • 1986 through 1993: 3rd Intercomparison – Solid Precipitation
1st WMO Intercomparison • Goals: • To determine reduction coefficients relating the catch efficiency of different gauge types • Reference Gauge: IPRG • Snowdown Gauge with Alter Shield • Results: Inconclusive – poor reference gauge
2nd WMO Intercomparison • Goals: • Evaluate wind corrections factors for rainfall • Correct systematic errors in different parts of the world • 60 gauge sites in 22 countries • Reference Gauge: Pit • Snowdon Gauge • Negligible wind losses • Results: Errors as a function of wind speed and precipitation intensity
3rd WMO Intercomparison (Goodison et al. 1998) • Goals: • Introduce reference method for gauge calibration • Derive standard method to adjust for wind-induced solid precipitation undercatch • Reference Gauge: • DFIR
Double-Fenced International Reference (DFIR) • Encloses the Shielded Tretyakov Gauge UCAR
Participating Countries • Canada, China, Croatia, Denmark, Finland, Germany, Iceland, India, Japan, Norway, Romania, Russia, Slovakia, Sweden, Switzerland, UK, USA. • DFIR operated at 19 stations in 10 countries during the study.
Results CATCH RATIO (CR) = Measured Precipitation True Precipitation
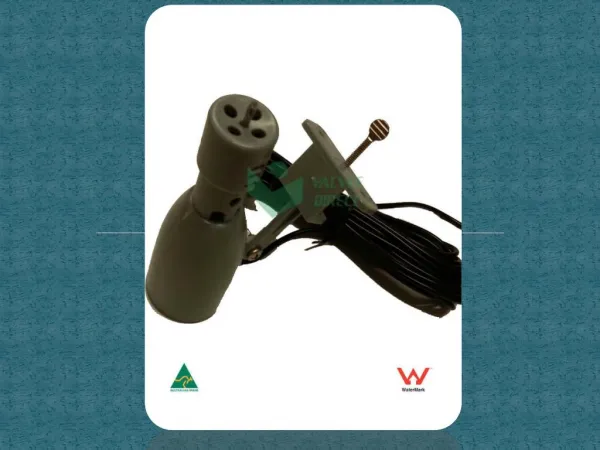
Smaller-Scale Studies • Mississippi: Lisa Sieck, Steve Burges Belfort with Weighing Mechanism Austrialian Hydrologic Services Gauge (TB3) Agricultural Research Service (ARS) Buried TB3
Smaller-Scale Studies • Urban Horticulture Center Gauges: Steve Burges Tipping Bucket Gauge Novalynx Collector Belfort with Weighing Mechanism
Some Available Precipitation Data Sets: Station Data • National Climatic Data Center (NCDC): • 15 minute, hourly, daily, monthly precipitation (also other surface observations) • ~6,000 precipitation stations with daily data • Mainly US but some non-US • No gauge undercatch corrections • Gridding of this data without prior corrections will cause time and space inhomogeneities
Some Available Precipitation Data Sets: Station Data • NCEP CPC Global Summary of Day (GSOD) data archive • ~15,000 stations worldwide with daily precipitation, wind speed, temperature, … • 1979 through 2001 • Archived at NCAR • Exchanged on the Global Telecommunications System (GTS) • Incomplete records, reporting errors, incorrect time interval reports, unrealistically large reports… • Inhomogeneous in time and space even within each country • Inhomogeneous gauge density • Some Former USSR reports include corrections for wetting losses (although done incorrectly)
Some Available Precipitation Data Sets: Station Data • Global Historical Climatology Network (GHCN) • ~7,500 stations worldwide with monthly precipitation (also temperature data available) • Through 1990 • Created from 15 data sources • Extensive QA/QC and adjustments for station inhomogeneities based on metadata information • No gauge undercatch corrections
Canadian Gauge-Corrected Data (Monthly Station Data) • 6,692 stations, through 1990 • Wetting, wind-induced undercatch • Assumed CR = 90% • 495 stations, through 1999 • Wetting, wind-induced, trace undercatch • Utilized WMO Results
Gridded Data • Spatial Interpolation of Gauge Measurements over Land Areas
Problems with Gridded Data • Uniformity of Station Density • Global precipitation – higher density in more developed countries • Gauge Type Uniformity • If not uniform, station data should be first be corrected for undercatch – specific to each gauge type • Station Representation – Do the stations used for gridding adequately represent the precipitation spatial patterns? • US stations mainly at airports • Stations located in valleys – orographic effects
Selecting a Gridded Data Set: What to be Aware of • Source of data: station data, QA/QC of station data, was the station data corrected for gauge undercatch? How homogeneous is the station data? • Interpolation Methodology: does this take into account orographic effects? • Spatial resolution and domain • Temporal resolution and period • Accessibility