Water Flow Modeling in Tule Lake Hydrology Project Using Network Analysis Techniques
The Tule Lake Hydrology Project employs innovative network analysis methods to model the complex water flow through irrigation and drainage canals at the Tule Lake National Wildlife Refuge, located on the California-Oregon border. This area, comprising wetlands and farmland, is crucial for migratory birds and the endangered Lost River Sucker fish. Our project aims to calculate monthly water flow volumes, improve irrigation efficiency, and address water quality concerns stemming from agricultural runoff, thus benefiting environmentalists, farmers, and stakeholders in the region.

Water Flow Modeling in Tule Lake Hydrology Project Using Network Analysis Techniques
E N D
Presentation Transcript
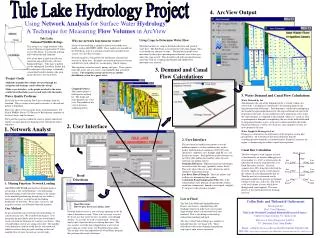
Tule Lake Hydrology Project Water Source 600m3 Lot 8301 Lot 8304 100m3 100m3 400m3 Lot 8305 Lot 8302 100m3 100m3 200m3 100m3 100m3 Lot 8306 Lot 8303 4. ArcView Output Using Network Analysis for Surface Water Hydrology: A Technique for Measuring Flow Volumes in ArcView Tule Lake National Wildlife Refuge This refuge is in a high mountain valley on the California-Oregon border 75 miles east of Mt. Shasta. It is unusual in being half wetland and half farmland. 80% of the birds in the Pacific Flyway migration stop at Tule Lake or Lower Klamath Refuges. Tule Lake is habitat for the endangered Lost River Sucker fish. The other part of the refuge is federally owned land leased to farmers who grow grains, potatoes, and sugar beets. Using Crops to Determine Water Flow Watershed models use slope to determine direction and speed of water flow. The Tule Basin is extremely flat (elevation change 10m), so we needed an alternate to slope. We decided to model water movement by the crop evapotranspirative demand, since water goes where the crops need it. This dovetails well with network functions, since they work by assuming that demand and supply drive movement on a network. Why use network functions for water? Surface water modeling is normally done in watershed raster models such as ARC/INFO GRID. These models are unusable for the Tule Basin, since it is a human created and controlled water system. It is also flat (see right). Network Analyst is designed for the distribution of goods and services in urban areas. Examples are choosing business locations and delivery truck, school bus, or emergency vehicle routing. The irrigation system has canals, pumps, and gates. These operate more like roads, one-way streets, and stoplights than watershed streams. The irrigation system can be seen as another distribution system for a good, water. 3. Demand and Canal Flow Calculations Project Goals Model the monthly flow volume of water through the irrigation and drainage canals within the refuge. Make a user interface, so the people involved in the water conflict described below can test and work with the model. Cropping Patterns The farmers plant 1-3 fields per leased farm lot. The shape and crops planted vary every year. This pulldown has a list of previous cropping patterns. 3. Water Demand and Canal Flow Calculations Water Demand by Lot The demand is the sum of the demands for the 1-3 fields within a lot. (above left). Lot demand is transferred to the matching point on the irrigation network (blue point). Field demand is calculated by multiplying the standard evapotranspiration rate by the crop coefficient relevant to the crop type on the field. A crop coefficient is how much more or less water the crop consumes as compared to the standard, which is 8” cut grass. This evapotranpirative demand is multiplied by the area of the field and divided by irrigation efficiency to get a total water volume needed by that field. Irrigation efficiency is always less than one, since irrigation systems are never perfectly efficient. Water Supply to Drainage by Lot Drainage is calculated as the inefficiency of the irrigation system plus precipitation. All water placed into the field greater than the evapotranspirative demand is considered runoff. Rainfall is erratic in the region, so farmers irrigate without regard to precipitation. Water Quality Problems Up to half the water entering Tule Lake is drainage from the farmland. This is causing water quality concerns, as the wetland habitat is degrading. This issue affects everyone in the basin: environmentalists, US Fish & Wildlife Service, US Bureau of Reclamation, members of the local towns, and the farmers. The water flow patterns within the canals is poorly understood, and the seasonal quantity of drainage water entering the lake is unknown. 2. User Interface 1. Network Analyst 2. User Interface The user interface enables non-experts to use the pulldown menus to set the conditions they wish to model. Both historical conditions (1990-1997) and speculative conditions (wet, drought, high ET, etc.) are listed in the menus. Each pulldown menu references an ArcView table holding the monthly values for each selection (see pullout on left). Irrigation Efficiency: Different irrigation technologies are used to water the crops (sprinkler, surface flood). This entry allows the user to alter efficiencies which simulate a technology change. Lost River Flow & Pump D: These are inflows and outflows for determining lake volume. Calculation Evapotranspiration (ETo): This is the standard plant water demand calculated from weather conditions (temperature, humidity, wind speed, sunlight). 8” cut grass is the reference standard. Canal flow Calculation The flow volume in each segment of canal is determined by an iterative adding process. A lot number (ex. 8301) is referenced in the table derived from the road directions (see Road Directions, far left). All canal segment (arcs) ID's along the route from the lot to the supply are given a value equal to the volume of water demanded by that lot. Then the next lot is referenced, and its demand is added to the previous lot demand volumes on the arcs, and so on. The result is the total volume of water which flows through each canal segment. The same process is then performed for the drainage network. Road Directions 1. Missing Function: Network Loading ARC/INFO NETWORK and ArcView Network Analyst are missing a very useful function: network loading. Network loading or network flow volume is the volume of the modeled good moving through any arc within a time period. This is a useful feature for finding bottlenecks on networks. Power lines, freeways, and irrigation systems can all benefit form this function. Lots to Flood The Tule Lake Wetland/Cropland Rotation Project, our client, is experimenting with flooding farm-lots to make early successional stage wetland, which is then rotated back into farmland. This is also being tested rotating wetland into farmland and back. The 'lots to flood' button brings up a window of clickable farm lots (see image left). Those clicked have their water demand changed from crop type to open water evaporation. Collin Bode and Thibaud d’Oultremont Developed for Prof. Carol Shennan, Tule Lake Wetland/Cropland Rotation Research Project, Center for Agroecology, UC Santa Cruz This was a Class Project for LA221, UC Berkeley, Prof. John Radke Email: collin@cats.ucsc.edu and tdoultre@nature.berkeley.edu Web Site: http://www4.ced.berkeley.edu:8004/radke_materials/materials/221-98hi/la221-au • Road Directions: • How to get a list of arcs along a route • Network Analyst creates a new coverage topology on the fly when it determines a route. There is no easy way to access the list of arcs that create the new arc theme, even through Avenue. As a result, we used a work-around. Network Analyst has a function that gives driving directions. This was saved as a text file then stripped down to a list of arc pairs using an avenue script (see Road Directions right). The arc pairs were then inputted to the Visual Basic program that performs the actual calculations. • Our Method • To get around the lack of tools for network loading, we constructed our own. We used Network Analyst 1.0 to determine the most likely route the water would take to reach each farm lot from one of 3 sources (see above). Then it would output a list of arcs along each route. The monthly water demand of each lot would then be calculated and added to each arc along the path, resulting in the total monthly flow of water for each arc (see far right).