Download

1 / 47
590 likes | 1.59k Vues
Structural Similarity Index. Presented By: Bishwa Sheth. Guided By: Dr. K. R. Rao. Why Image quality measure What is Image quality measure Types of quality assessment MSE – Mean square error SSIM- Structural similarity index method VIF – Virtual information fidelity Simulation results

E N D
Structural Similarity Index Presented By: Bishwa Sheth Guided By: Dr. K. R. Rao
Why Image quality measure What is Image quality measure Types of quality assessment MSE – Mean square error SSIM- Structural similarity index method VIF – Virtual information fidelity Simulation results Conclusion References Topics to be Covered
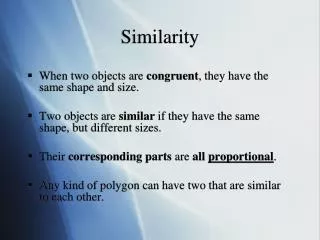
Why Image quality? • Digital images are subject to wide variety of distortions during transmission, acquisition, processing, compression, storage and reproduction any of which may result in degradation of visual quality of an image. • E.g. lossy compression technique – used to reduce bandwidth, it may degrage the quality during quantization process. • So the ultimate aim of data compression is to remove the redundancy from the source signal. Therefore its reduces the no of binary bits required to represent the information contained within the source.
What is Image Quality Assessment? • Image quality is a characteristic of an image that measures the perceived image degradation • It plays an important role in various image processing application. • Goal of image quality assessment is to supply quality metrics that can predict perceived image quality automatically. • Two Types of image quality assessment • Subjective quality assessment • Objective quality assessment
Subjective Quality Measure • The best way to find quality of an image is to look at it because human eyes are the ultimate viewer. • Subjective image quality is concerned with how image is perceived by a viewer and give his or her opinion on a particular image. • The mean opinion score (MOS) has been used for subjective quality assessment from many years. • In standard subjective test where no of listeners rate the heard audio quality of test sentences reas by both male and female speaker over the communication medium being tested. • Too Inconvenient, time consuming and expensive
Example of MOS score • The MOS is generated by avaragin the result of a set of standard, subjective tests. • MOS is an indicator of the perceived image quality. MOS score [24] • MOS score of 1 is worst image quality and 5 is best.
Objective Quality Measure • Mathematical models that approximate results of subjective quality assessment • Goal of objective evalution is to devlope quantative measure that can predict perceived image quality • It plays variety of roles • To monitor and control image quality for quality control systems • To benchmark image processing systems; • To optimize algorithms and parameters; • To help home users better manage their digital photos and evaluate their expertise in photographing.
Objective evaluation • Three types of objective evaluation • It is classified according to the availability of an original image with which distorted image is to be compared • Full reference (FR) • No reference –Blind (NR) • Reduced reference (RR)
Full reference quality metrics • MSE and PSNR: the most widely used video quality metrics during last 20 years. • SSIM: new metric (was suggested in 2004) shows better results, than PSNR with reasonable computational complexity increasing. • some other metrics were also suggested by VQEG, private companies and universities, but not so popular. • A great effort has been made to develop newobjective quality measures for image/video that incorporate perceptual quality measures by considering the human visual system (HVS)characteristics
HVS – Human visual system • Quality assessment (QA) algorithms predict visual quality by comparing a distorted signal against a reference, typically by modeling the human visual system. • The objective image quality assessment is based on well defined mathematically models that can predict perceived image quality between a distorted image and a reference image. • These measurement methods consider human visual system (HVS) characteristics in an attempt to incorporate perceptual quality measures.
MSE – Mean square error • MSE and PSNR are defined as (1) (2) Where x is the original image and y is the distorted image. M and N are the width and height of an image. L is the dynamic range of the pixel values.
Property of MSE • If the MSE decrease to zero, the pixel-by-pixel matching of the images becomes perfect. • If MSE is small enough, this correspond to a high quality decompressed image. • Also in general MSE value increases as the compression ratio increases.
Original “Einstein” image with different distortions, MSE value [6] (a) Original Image MSE=0 (b) MSE=306 (c) MSE=309 (d) MSE=309 (e) MSE=313 (f) MSE=309 (g) MSE=308
SSIM – Structural similarity index • Recent proposed approach for image quality assessment. • Method for measuring the similarity between two images.Full reference metrics • Value lies between [0,1] • The SSIM is designed to improve on traditional metrics like PSNR and MSE, which have proved to be inconsistant with human eye perception. Based on human visual system.
SSIM measurement system Fig. 2.Structural Similarity (SSIM) Measurement System [6]
Example images at different quality levels and their SSIM index maps[6]
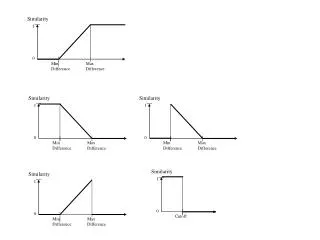
Equation for SSIM • If two non negative images placed together Mean intensity (3) • Standard deviation (4) - Estimate of signal contrast • Contrast comparison c(x,y) - difference of σx and σy (5) • Luminance comparison (6) • C1, C2 are constant.
Equation for SSIM Structure comparison is conducted s(x,y) on these normalized signals (x- µx )/σx and(y- µy )/ σy (7) (8) (9) (10) α, β and γ are parameters used to adjust the relative importance of the three components.
Property of SSIM • Symmetry: S(x,y) = S(y,x) • Bounded ness: S(x,y) <= 1 • Unique maximum: S(x,y) = 1 if and only if x=y (in discrete representations xi = yi, for all i= 1,2…….,N ).
MSE vs. MSSIM • MSE=226.80 MSSIM =0.4489 MSE = 225.91 MSSIM =0.4992
MSE vs. MSSIM • MSE = 213.55 MSSIM = 0.3732 MSE = 225.80 MSSIM =0.7136
MSE vs. MSSIM • MSE = 226.80 MSSIM = 0.4489 MSE = 406.87 MSSIM =0.910
Why MSE is poor? • MSE and PSNR are widely used because they are simple and easy to calculate and mathimatically easy to deal with for optimization purpose • There are a number of reasons why MSE or PSNR may not correlate well with the human perception of quality. • Digital pixel values, on which the MSE is typically computed, may not exactly represent the light stimulus entering the eye. • Simple error summation, like the one implemented in the MSE formulation, may be markedly different from the way the HVS and the brain arrives at an assessment of the perceived distortion. • Two distorted image signals with the same amount of error energy may have very different structure of errors, and hence different perceptual quality.
Virtual Image Fidelity (VIF) • Relies on modeling of the statistical image source, the image distortion channel and the human visual distortion channel. • At LIVE [10], VIF was developed for image and video quality measurement based on natural scene statistics (NSS). • Images come from a common class: the class of natural scene.
VIF – Virtual Image Fidelity Mutual information between C and E quantifies the information that the brain could ideally extract from the reference image, whereas the mutual information between C and F quantifies the corresponding information that could be extracted from the test image [11]. Image quality assessment is done based on information fidelty where the channel imposes fundamental limits on how mauch information could flow from the source (the referenceimage), through the channel (the image distortion process) to the receiver (the human observer). • VIF = Distorted Image Information / Reference Image Information
VIF quality • The VIF has a distinction over traditional quality assessment methods, a linear contrast enhancement of the reference image that does not add noise to it will result in a VIF value larger than unity, thereby signifying that the enhanced image has a superiorvisual quality than the reference image • No other quality assessment algorithm has the ability to predict if the visual image quality has been enhanced by a contrast enhancement operation.
Simulation Result • MSE vs. SSIM • Lena.bmp • Goldhill.bmp • Couple.bmp • Barbara.bmp • SSIM vs. VIF • Goldhill.bmp • Lake.bmp • JPEG compressed image • Lena.bmp • Tiffny.bmp
Comparison of QF, CR and MSSIM CR= 0 MSSIM = 1 Q.F = 1 CR= 52.79 MSSIM =0.3697
Comparison of QF, CR and MSSIM Q.F = 4 CR= 44.50 MSSIM = 0.4285 Q.F = 7 CR= 33.18 MSSIM = 0.5041
Comparison of QF, CR and MSSIM Q.F = 10 CR= 26.81MSSIM = 0.7190 Q.F = 15 CR= 20.65 MSSIM = 0.7916
Comparison of QF, CR and MSSIM Q.F = 20 CR= 17.11 MSSIM = 0.8158 Q.F = 25 CR= 14.72 MSSIM = 0.8332
Comparison of QF, CR and MSSIM Q.F = 45 CR= 9.36 MSSIM = 0.8732 Q.F = 80 CR= 4.85 MSSIM = 0.9295
Comparison of QF, CR and MSSIM Q.F = 45 CR= 3.15 MSSIM = 0.9578 Q.F = 99 CR= 1.34 MSSIM = 0.9984
Conclusion • The main objective of this project was to analyze SSIM Index in terms of compressed image quality. • I explained why MSE is a poor metric for the image quality assessment systems [1] [6]. • In this project I have also tried to compare the compressed image quality of SSIM with VIF. • By simulating MSE, SSIM and VIF I tried to obtain results, which I showed in the previous slides.
Conclusion • As shown in the simulation figure: 1, where the original “Einstein” image is altered with different distortions, each adjusted to yield nearly identical MSE relative to the original image. Despite this, the images can be seen to have drastically different perceptual quality. • Only VIF has the ability to predict the visual image quality that has been enhanced by a contrast enhancement operation. • For the JPEG compression, quality factor, compression ratio and MSSIM are related with each other. So as quality factor increases compression ratio decreases and so MSSIM increases. • The distortions caused by movement of the image acquisition devices, rather than changes in the structures of objects in the visual scene. To overcome this problem to some extent the SSIM index is extended into the complex wavelet transform domain. • The quality prediction performance of recently developed quality measure, such as the SSIM and VIF indices, is quite competitive relative to the traditional quality measure.
References [1] Z. Wang and A. C. Bovik, “Image quality assessment: from error visibility to structural similarity,” IEEE Trans. Image Processing, vol. 13, pp. 600 – 612, Apr. 2004. www.ece.uwaterloo.ca/~z70wang/publications/ssim.html [2] Z. Wang and A. C. Bovik, “Modern image quality assessment”, Morgan & Claypool Publishers, Jan. 2006. [3] M. Sendashonga and F Labeau, “Low complexity image quality assessment using frequency domain transforms,” IEEE International Conference on Image Processing, pp. 385 – 388, Oct. 2006. [4] S. S. Channappayya, A. C. Bovik, and R. W. Heath Jr, “A linear estimator optimized for the structural similarity index and its application to image denoising,” IEEE International Conference on Image Processing, pp. 2637 – 2640, Oct. 2006. [5] Z. Wang and A.C. Bovik, “A universal image quality index,” IEEE signal processing letters, vol. 9, pp. 81-84, Mar. 2002. [6] X. Shang, “Structural similarity based image quality assessment: pooling strategies and applications to image compression and digit recognition” M.S. Thesis, EE Department, The University of Texas at Arlington, Aug. 2006.
References [7] H. R. Sheikh and A. C. Bovik, “A visual information fidelity approach to video quality assessment,” The First International Workshop on Video Processing and Quality Metrics for Consumer Electronics, Scottsdale, AZ, Jan. 23-25, 2005 http://live.ece.utexas.edu/publications/2005/hrs_vidqual_vpqm2005.pdf [8] H. R. Sheikh and A. C. Bovik, “Image information and visual quality,” IEEE Trans. Image Processing, vol. 15, pp. 430 – 444, Feb. 2006. [9] A. Stoica, C. Vertan, and C. Fernandez-Maloigne, “Objective and subjective color image quality evaluation for JPEG 2000- compressed images,” International Symposium on Signals, Circuits and Systems, 2003, vol. 1, pp. 137 – 140, July 2003. [10] H. R. Sheikh, et al, “Image and video quality assessment research at LIVE,” http://live.ece.utexas.edu/research/quality/. [11] A. C. Bovik and H. R. Sheikh, “Image information and visual quality- a visual information fidelity measure for image quality assessment,” http://live.ece.utexas.edu/research/Quality/VIF.htm. [12] H. R. Wu and K. R. Rao, “Digital video image quality and perceptual coding,” Boca Raton, FL: Taylor and Francis 2006. [13] A. M. Eskicioglu and P. S. Fisher, “Image quality measure and their performance,” IEEE signal processing letters, vol. 43, pp. 2959-2965, Dec. 1995.
References [14] Z. Wang, H. R. Sheikh and A. C. Bovik, “Objective video quality assessment”, Chapter 41 in The handbook of video databases: design and applications, B. Furht and O. Marqure, ed., CRC Press, pp. 1041-1078, September 2003. http://www.cns.nyu.edu/~zwang/files/papers/QA_hvd_bookchapter.pdf [15] Z. Wang, A. C. Bovik and Ligang Lu , “Why is image quality assessment so difficult", IEEE International Conference on Acoustics, Speech, and Signal Processing, Proceedings. (ICASSP '02), vol. 4, pp. IV-3313 - IV-3316, May 2002. [16] T. S. Branda and M. P. Queluza, “No-reference image quality assessment based on DCT domain statistics” Signal Processing, vol. 88, pp. 822-833, April 2008. [17] B. Shrestha, C. G. O’Hara and N. H. Younan, “JPEG2000: Image quality metrics” [18] http://media.wiley.com/product_data/excerpt/99/04705184/0470518499.pdf [19] http://en.wikipedia.org/wiki/Subjective_video_quality [20] H. R. Sheikh, A. C. Bovik, and G. de Veciana, "An Information Fidelity Criterion for Image Quality Assessment Using Natural Scene Statistics," IEEE Transactions on Image Processing, in Publication, May 2005. [21] http://www.cns.nyu.edu/~zwang/files/research/quality_index/demo_lena.html [22] http://live.ece.utexas.edu/research/Quality/vif.htm [23] http://www.ece.uwaterloo.ca/~z70wang/research/ssim/ [24] http://en.wikipedia.org/wiki/Mean_Opinion_Score [25] www-ee.uta.edu/dip