Download
1 / 13
140 likes | 236 Vues
Comprehensive Profiling of the Proteome, Lipidome , and Metabolome Enabled Using a Prototype UPLC-Compatible Microfluidic Device

E N D
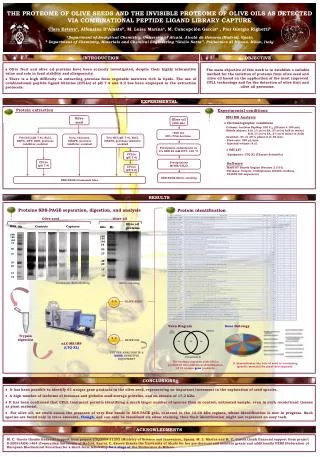
Comprehensive Profiling of the Proteome, Lipidome, and Metabolome Enabled Using a Prototype UPLC-Compatible Microfluidic Device J. Will Thompson 1, Jay Johnson2, Giuseppe Astarita2, Giuseppe Paglia2, Jim Murphy2, Steven Cohen2, Jim Langridge4, Geoff Gerhardt2, and M. Arthur Moseley1 1Duke Proteomics Core Facility, Durham , NC; 2Waters Corporation, Milford, MA; 3Center for Systems Biology, University of Iceland, 4Waters Corporation, Manchester, UK
Benefits and Compromises of Changing Column Diameters for Various Applications Compromises 4-5x sample required 10-20% increase in time Source/ionization flexibility Compromises Benefits 2-4x Speed & Efficiency/time 1/20 Solvent/Sample Consumption 20-40x Sensitivity Benefits 0.075 mm 0.150 mm 2.1 mm Must be weighed for each individual application
Tile Design and Flow Diagram ESI Emitter Assembly Electrical Connections (EEPROM, Heater) Incoming flow Analytical Column Trap Column
Evaluation Areas for Prototype 150 um Tile Targeted Peptide Quant, Method Development and Deployment Label-Free Quantitation, Proteomics Metabolomics (RPLC and HILIC) Lipid Profiling (Flow Injection)
Summary of Multi-Omics Sample Preparation Strategy Cell Disruption (Sonication in AmBic pH8) Bradford Assay, 1.8mg/sample(normalize by total lysate) Proteins ~4% 0.25% w/v Rapigest DTT/IAA/trypsin overnight Polar Metabolites ~48% 80/20 MeOH/water 1 hrextraction, N2 dry Lipids ~48% 80/20 MTBE/MeOH 1 hr extraction, N2 dry Resuspend 2/1/0.2 MeCN/ Formic Acid/HFBA Inject 1% for LC-MS/MS (30 min/sample) Resuspend 4/2/1 IPA/MeOH/CHCl3 Inject 4% for FIA (10 min/sample) Acidify 1/2/97 TFA/MeCN/water Inject 20% for 2DLC-MS/MS (3 hr/sample)
150 um Prototype TileDirect Inject/Flow Injection Fluidic Diagram Sample Needle 2 1 3 6 150 um Tile 4 5 Tile options tested: 5, 10, 20 cm BEH C18 HSS T3 C18 CSH C18 BEH C4 BEH Amide HILIC Infusion Tile A B Analytical Pump
RPLC Metabolomics Method • Analysis used 1% of isolate: • 150 um x 10 cm 1.7 um BEH C18 tile, F = 2.0 ul/min at 45°C • Mobile phase A: 0.1% Formic acid, 0.02% HFBA, in water • Mobile Phase B: 0.1% Formic acid in 10/90 IPA/MeCN • Mass Spectrometry: Synapt G2 HDMS, Resolution mode (25,000 Rs) @ 5Hz Arginine Phenylalanine MP B Compos. BPI >17,000 metabolite Features in 12 minutes m/z S-adenosyl methionine (SAM) 5-methylthioadenosine (MTA) Time (min)
Lipid Profiling using Flow Injection Analysis and an Infusion Tile • Analysis of the Lipid Isolate from MCF7 cells (prepared using MTBE/MeOH extraction). • Ion-Mobility Data-Independent Analysis • Synapt G2, 0.6 sec scans (6V or 15-45V) • 3 ul/min flow rate • Mobile phase was 10/90 IPA/MeCN with 0.1% formic acid m/z Ion Mobility Approximately 600 unique lipid species quantified in a 4 minute run (5 min cycle)
150 um Prototype Tile2D with Dilution Fluidics RP1 - Xbridge-BEH130 C18 NanoEase Column, 5μm, 300 μm x 50 mm Trap - UPLC Symmetry C18 Trap, 5 μm, 180 μm x 20 mm MS/MS - Synapt G2 – hdDIA (hdMSE)
Goals for High-Throughput Proteomics Analysis Using 2DLC and TRIZAIC Time per sample (hr) 0 1 2 3 4 5 * 90 min gradient @ 0.4 ul/min * 37 min gradient @ 0.4 ul/min (nano) or 3 uL/min (Tile) 18.5 min gradient @ 3 uL/min (Tile) ** 18.5 min gradient @ 3 uL/min (Tile) * Current “standard” configurations **Potential elimination of between-fraction trapping time with dual-trap 2DLC prototype (K. Fadgen and M. Staples) Initial Trapping Step Fraction Elution to 2nd Dimension Analytical Separation
2D LC/MS/MS on Synapt G2nanoLC vs150 um Tile 75 um x 150 mm BEH C18 column 7 to 35% MeCN in 37 min, 0.5 ul/min 150 um x 100 mm BEH C18 nanoTile 7 to 35% MeCN in 18.5 min, 3.0 ul/min
TRIZAIC 150 2DLC ConfigurationChromatographic Evaluation versus 75 um Capillary Column technology
AcknowledgmentsDuke University Proteomics Core Facilityhttp://www.genome.duke.edu/cores/proteomics/ Funding NIH S10 grant Duke School of Medicine CTSA grant UL1RR024128