Empowering Fragile States: Addressing Poverty in Gender Equality Issues
Explore the challenges of gender equality and fragile states in overcoming poverty and achieving MDGs. Assess the impact of poverty reduction strategies in different regions with a focus on fragile states. Learn about the importance of environmental sustainability and the role of international partnerships in promoting development.

Empowering Fragile States: Addressing Poverty in Gender Equality Issues
E N D
Presentation Transcript
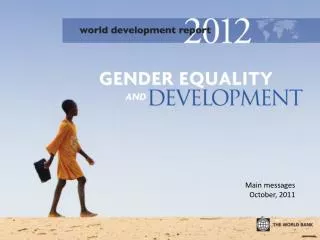
Main messages Confronting the Challenges of Gender Equality and Fragile States Brussels May 11, 2007
Figure 1.1: Share of people living on less than $1 or $2 a day (%) (with estimates for 2004 and projection for 2015) Significant progress toward MDG1 Globally MDG1 is on track (2015 forecast HCI=12%). Source: World Bank staff estimates (weighted averages)
Figure 1.1: Share of people living on less than $1 or $2 a day (%) (with estimates for 2004 and projection for 2015) Regional progress differs sharply East Asia has already surpassed the MDG1 target. Sub-Saharan Africa lags well behind the target. Share of people living on less than $1 or $2 a day (%) – East Asia and Sub-Saharan Africa (with estimates for 2004 and projection for 2015) Source: World Bank staff estimates (weighted averages)
The pace of poverty reduction depends on more than growth * China: 1999-2004 Burkina Faso:1998-2003 Brazil: 1999-2002 Mozambique: 1996-2002 India: 1994-2005 Nigeria: 1996-2003 Laos: 1997-2002 Peru: 1996-2003 Source: World Bank – Development Economics
But also cautionary notes… Risks to positive outlook – unwinding of global imbalances (US trade deficit), pandemic, oil price volatility. • Environmental sustainability: growth for many is through depleting their natural assets. • Fragile states are being left out: weak growth, little progress with poverty reduction, persistent fragility Unadjusted and Adjusted Net Savings Figure presents the calculation of adjusted net saving in Bolivia in 2003
Lagging growth performance in fragile states • Defined by weak governance and institutions; often affected by conflict. • Fragile states have consistently grown more slowly than other low-income countries. • State fragility has proven to be a persistent condition—21 of the 34 states judged as fragile in 1980, were still viewed as such in 2005.
Advancing the MDGs--Fragile states are least likely to meet MDG1 Extreme poverty is increasingly concentrated in Fragile states • 35 states—home to 9% (500 million) of the developing world’s population and 27% of its extreme poor. • State fragility has proven to be a persistent condition—21 of the 34 states judged as fragile in 1980, were still viewed as such in 2005. • Impact beyond borders. • Pose a dilemma for development community.
Fragile states are the least likely to meet the MDGs • Facing the largest MDG gap; 27% of extreme poor; nearly 1/3 of child deaths and children not completing school; ¼ of the HIV positive population • Reforms approved for rapid response procedures, organization and staffing (WB). • Need to implement these reforms, strengthen international partnerships, and deepen lessons on approaches. Sources: World Bank Staff estimates
The Role of Quality in MDG Progress Message 1: Accelerating progress on HD MDGs, but not enough to meet the goals • All regions – and 80% of countries -- off track on child mortality goal • South Asia off track on all goals • Sub-Saharan Africa off track on all goals • …but some countries in every region showing exceptional results • Mozambique, Cambodia, Benin, Rwanda and Niger in primary completion • Timor Leste, Vietnam, Bhutan, Mongolia and Eritrea on child mortality • Increase in ART access (Botswana, Kenya, South Africa and Uganda have reached 50% of those in need) and declining HIV prevalence in some countries • Malawi and Namibia on track to water target; Senegal on sanitation
Message 2: ODA for HD has increased, but uneven progress on harmonization ODA for HD is increasing …especially in health
In Rwanda, only 14% of donor health funding is channeled through MOH and 12% through health districts: 74% managed by donors directly 85% of reported health funding goes to AIDS and malaria Aid flows are highly volatile, due to mostly 1-2 year commitments Limited funding for health system strengthening and investments outside health EFA FTI is fostering harmonization and alignment in education… but these remain key issues in health
Message 3: The poor are benefiting from MDG progress, especially in education Pro-poor progress on primary completion…
Message 4: A stronger focus on quality is needed – even while scaling up quantity Too many children are failing to learn….
Reading research shows widespread problems… • In India, a 2005 nationwide survey conducted by Pratham showed 68% of children in grades 2-5 could not read a very short paragraph • In Peru, 46% of children at the end of 2nd grade in 2005 could not read a single word of a first grade text in 2005 • In Kenya, 30% of 2nd and 3rd graders unable to read any words in a first grade text in 2006 • In rural Cameroun, 80% of 3rd grade students in 2005 could not read a single word of a first grade text New research also shows quality issues in health delivery: competence/practice gap • In Tanzania in 2004, 67% of clinicians mistreated TB and 24% mistreated malaria • In India, doctors completed only 26% of recommended protocol for diagnosing TB and 18% of the protocol for a child with diarrhea
Quality in health delivery: where doctors work affects “competence/practice gap” • Institutional setting and “high powered incentives” make a difference – doctors in autonomous facilities more likely to perform up to ability • Contracting for results in Cambodia, Argentina, Afghanistan, Rwanda is showing some promise
Stronger focus on quality needed in both education and health • No evidence of an inherent “tradeoff” between access and quality over long term • Globally, highest performing education and health systems have broadest access • Extending basic services to all crucial for equity, long-term social stability, and economic gains from human development • But closer monitoring of quality needed as countries scale up • Measure quality in terms of results: • outputs (level of patient service delivered and instructional time) and outcomes (student learning, health outcomes). • Inputs (qualification levels, numbers of clinics) don’t guarantee results • Create incentives aligned with quality • International support to develop a globally-benchmarked learning assessment relevant for developing countries • Support experimentation and evaluation of “contracting for performance” in health
Gender equality is measured in 3 domains: Leveling the field of opportunities Gender equality in rights, resources and voice Household Household resource and task allocations Fertility decisions Economy & markets Access to land Financial services Labor markets Technology Society Civic and political participation Domain of choices, Domain of policy Aggregate economic performance (poverty reduction, growth)
Increased equality has intrinsic and instrumental value Increased gender equality in households, markets and society Mother’s greater control over decision-making in households Women have better access to markets Women have better education and health Increased women’s labor force participation, productivity and earnings Improved children’s well-being Better health and educational attainment & greater productivity as adults Income / consumption expenditure Differential savings rate Future poverty reduction and economic growth Current poverty reduction and economic growth
SSA EAP ECA LCR MNA SAR 1 1 Female to Male Ratio Share of women .5 .5 0 0 Female to Male ratio in (S) Secondary Par: Proportion Seats held by women in Parliament 2005 1990 Source: World Bank Indicators. The regional averages are calculated using the earliest value sandwiched between 1990 and 1995 and the latest value between 2000 and 2005. The averages are weighted by the country population size in 2005. Gender equality is about fairness, opportunity, and smart economics Tracking gender equality over time: 1990-2005 Importance:Intrinsic value; economic value; broader linkages to development Performance:Major gains in enrollment parity: 83 of 106 countries by 2005. Elsewhere performance lags: labor force participation, political representation. Monitoring: Need for better indicators and greater monitoring effort. Mainstreaming:requires realistic goals; leadership, technical expertise and financing.
Official MDG indicators do not fully monitor gender equality and empowerment • They exclude important elements of gender equality such as health. • They poorly measure gender equality in education, employment and political participation. • They monitor performance on national averages which can mask inequality within countries Source: Duryea, Galiani, Nopo and Piras (2006)
Monitoring child mortality reveals additional problem regions Female under-5 mortality rate and female to male ratio, 2004 Source: World Population Prospects 2004.
The unfinished agenda • Closing gaps in well-being and opportunities for girls and women in disadvantaged sub-groups within nations. • Giving priority to Sub-Saharan Africa. • Paying special attention to MDG3 issues in fragile states. • Scaling up collection of sex disaggregated data to measure progress (especially, in the domains of society and the market and economy).
Aid quality and scaling up: actions lag commitments DAC Members’ ODA: 1990-05 and prospects 2006-10 • ODA: • Dimming prospects for scaling up aid. • aid concentration—most are not seeing increases. • aid quality—increasing fragmentation; earmarking; lack of predictability, inadequate ‘flexible aid’. • Scaling-up: opportunities exist—a range of reforming countries is well positioned to absorb scaled-up aid; the challenge is to establish an effective mechanism for scaling up. Source: OECD DAC.
.… especially in Sub-Saharan Africa • At the Gleneagles Summit, G-8 leaders promised to double aid to Africa by 2010: • Nearly two years later, that increase in not translating into actual increases • SSA is seeing little new aid beyond debt relief. • Aid to Africa (excl. Nigeria) declined in 2005; preliminary data show that these flows stagnated in 2006. Evolution of net ODA to SSA
Donor focus on fragile states is increasing, but much remains to be done Aid per capita by type of country group • An improving trend in aid to fragile states • In 2005, aid rose by more than two-thirds to nearly $20 billion (in 2004 dollar terms); aid flows continue to be volatile, however. • Aggregate trends mask the wide variation across different types of fragile states: postconflict states typically receive more aid than other fragile states. • Much remains to be done to improve development effectiveness in fragile states • International actors need to adopt “whole of government” approaches—those that require close collaboration between economic, development, diplomatic, and security actors. • Donor agencies’ capacity to respond quickly to changing environments needs to be strengthened. Source: OECD DAC database and staff estimates. Data exclude India. Aid is net ODA less humanitarian aid and debt relief.
Donor support for gender equality: the way forward Gender equality focus of bilateral ODA by sector (2001-05) • A quarter of all bilateral ODA allocated by sector has a gender focus. • Despite strong policy commitments to gender equality, implementation has been disappointing. • The way forward: • selectivity in gender mainstreaming • results orientation with strengthened M&E • stronger organizational arrangements for gender-specific actions and mainstreaming. • - synergies with aid effectiveness agenda Source: OECD DAC. Not all donors report the gender focus of their aid.
The global aid architecture is becoming more complex • More coherence among donors, developing countries and IFIs needed: • profusion of aid channels—newly emerging donors, private foundations, global vertical funds • aid fragmentation—large number of aid vehicles and small average size of funded activities • The initial situation regarding H&A is modest • The Baseline Survey on Monitoring the Paris Declaration finds that: • - only 24% of missions were jointly undertaken and around half of country analytic work was joint • - only a third of countries have PFM systems that are moderately strong or better (score of 4 or higher) and less than 40% of aid uses partners’ PFM system or procurement systems • Participants need to do more to operationalize the Paris framework. • The Paris Principles address some of the challenges to making aid more effective, but more is needed to achieve coherence in the aid architecture.
Role and performance of IFIs is under pressure • Lending: Demand for loans increased in 2006; but future of concessional capacity in question (MDB share of aid? MDRI impact?). • Management for results: sustained focus but slow progress. • Gender equality: more focus (e.g., GAP) but implementation lags design; and mainstreaming needs accountability. • Fragile states: need for more resources in balance with country capacity.
Summary of key messages • Growth is reducing poverty, but not everywhere or always sustainably; many countries are failing to benefit, especially fragile states. • On the HD front quality lags quantity—children enroll in school but don’t always learn. • Investing in gender equality and empowerment of women is smart economics—better monitoring and mainstreaming of women’s empowerment and equality into policy formulation and aid programs are vital to the development agenda. • Fragile states are failing to keep up—speed and staffing by development agencies are critical. As well, there is need to pay special attention to MDG3 issues in fragile states. • Scaling up actions lag commitments of more and better aid; scaling up “quality” aid requires greater coherence among donors, developing countries, and international agencies.
Thank you The GMR and related materials are available at: http://www.worldbank.org/gmr2007