Download
1 / 15
150 likes | 313 Vues
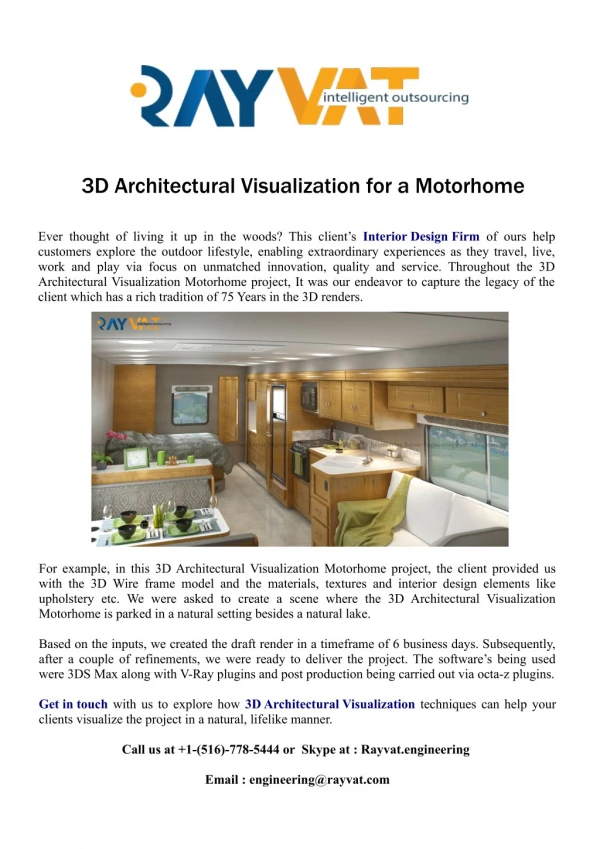
A Dynamic 3D Traffic and GIS Model for Enhanced Visualization in Planning. Daniel Morgan Caliper Corporation May 19, 2009. SAFETEA-LU.

E N D
A Dynamic 3D Traffic and GIS Model for Enhanced Visualization in Planning Daniel Morgan Caliper Corporation May 19, 2009
SAFETEA-LU • In carrying out subparagraph (A), the metropolitan planning organization (or state) shall, to the maximum extent practicable, employ visualization techniques to describe plans • Context: Public Involvement and Participation (2 references): • § 134. Metropolitan transportation planning; (i) Development of Transportation Plan • § 135. Statewide transportation planning; (f) Long-Range Statewide Transportation Plan
What is Visualization in Planning?From the FHWA: • Anything that, through visual imagery, strengthens public participation in the planning and project delivery process and that aids the public in understanding proposed plans • “The effective presentation of projects' impacts to the public” • Examples: • Sketches • Drawings • Artist renderings • Physical models and maps • Simulated photos • Videos • Computer modeled images • Interactive GIS systems • GIS-based scenario planning tools • Photo manipulation • Computer simulation
What is Visualization in Planning?From the TRB Visualization Committee: • “Much of the interest [in visualization as it relates to transportation] in the mid-90’s evolved around creating 3D geometry, images, and animations to better communicate how proposed projects will “look”” • “Today, visualization and its related forms of simulation and modeling, have evolved considerably, advancing the boundaries of how we can plan, deliver, operate, and maintain these infrastructure… as well as the education and training of tomorrow’s professionals”
What is Visualization in Planning?From AASHTO: • A simulated representation of proposed transportation improvements and their associated impacts on the surroundings in a manner sufficient to convey to the layperson the full extent of the improvement • Visualization should: • Make it possible to more clearly understand complex technical information • Provide enough information to convey the difference between proposed alternatives and existing conditions • Examples: • Photography • Photogrammetry • Digital imaging • Geographic Information Systems (GIS) • Computer Aided Design • Computer graphics
Technologies • Web Solutions • Google Earth and 3D Warehouse • Microsoft Virtual Earth • Desktop Solutions • CAD (AutoCAD, MicroStation, etc.) • 3D (3D Studio, Sketchup, etc.) • GIS (ArcView, Maptitude, MapInfo, etc.) • Transportation Planning Software • Traffic Simulation Software
A Dynamic 3D Traffic and GIS Model • GIS with support for a wide range of geographic file formats • 2D cartographic visualization • Traffic simulation models of varying levels of detail • Detailed lane-level geographic & geometric roadway visualization • 2D and 3D vehicle animation visualization • 3D scene-building capability • 3D visualization • Implemented in TransModeler
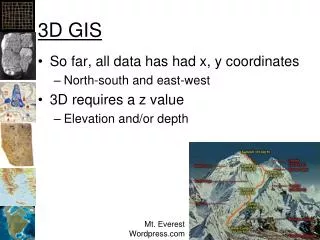
3D Modeling • Aerial imagery • Common formats: TIF, JPEG, MrSID, ECW • Polygon geographic file representing building footprints and heights • Digital elevation models (DEM) • User’s own 3D models • Common formats: 3ds, VRML, IV, Skp • Any combination of the above
Summary • Combines many of the visualization techniques suggested by FHWA, TRB, and AASHTO: GIS, CAD, simulation/animation, Digital imagery, computer graphics, etc. • Integrates all of the above in a GIS environment • Exploits variety of data, 3D & GIS, already available or inexpensive to obtain • Without the high cost and specialization (i.e. learning curve) of separate CAD, GIS, or simulation software • Built in a system designed for traffic modeling and simulation


![[TC]²: Leaders in 3D Visualization and 3D Scanning Services](https://cdn4.slideserve.com/8407116/tc-leaders-in-3d-visualization-and-3d-scanning-dt.jpg)