Analyzing Socioeconomic Impact on Health: Portsmouth Census Tracts and STDs
140 likes | 256 Vues
This report presents an analysis of Portsmouth's census tracts from 1970 and 2000, examining the correlation between poverty levels and health outcomes. Utilizing geocoding methods developed by the Harvard Geocoding Project, it details the annual age-standardized incidence rates for HIV/AIDS and STDs in Virginia from 2000 to 2005, highlighting high-risk areas. With over 30 years of data, this analysis reveals significant trends in health disparities related to socioeconomic status, emphasizing the need for targeted public health interventions.

Analyzing Socioeconomic Impact on Health: Portsmouth Census Tracts and STDs
E N D
Presentation Transcript
Chris Delcher, M.S.Epidemiologistchris.delcher@vdh.virginia.govGIS in Public Health Virginia Department of HealthDivision of Disease PreventionMonday September 17th, 2007
Portsmouth 1970 Census Tracts Hand drawn Digital High - > $10,000 Middle - $6,000-$9,999 Low - <=$5,999 Percent households living under federal poverty line
What is Geocoding? Street Database • Address: • 920 Main St. • Richmond, VA 23220 905 Main St. X1, Y1 910 Main St. X2, Y2 920 Main St. X3, Y3 930 Main St. X4, Y4 940 Main St. X5, Y5 • Longitude (X3):-77.451723 • Latitude (Y3):37.550164
Portsmouth 1970 Census Tracts Portsmouth 2000 Census Tracts
37 Years 1968 2005 *2005 Gonorrhea cases were removed from this slide. The spatial distribution was similar to the 1968 distribution.
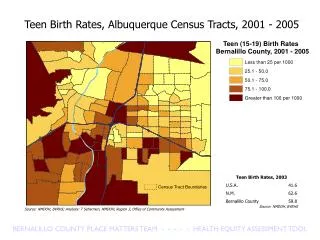
High Risk Areas (census tracts) were calculated. Hatching shows census tracts with less than 1,500 people
Average annual age-standardized incidence rates for HIV/AIDS and STDs in Virginia (2000-2005), by poverty level
Passenger seats (black) SARS case (X) “The nearest neighbor index of passenger’s seats was 0.931 indicating that the distribution was random, not clustered.” Source: Marta A. Guerra, Senior Staff Epidemiologist, Centers for Disease Control Prevention