FINANCE
FINANCE. January 16, 2013. What is Financial Management?. Art & Science of managing money. Primary Activities. Financing Decision Raising of funds; amount, sources Investment Decision Buy assets; fixed assets/projects Current Assets/Working Capital

FINANCE
E N D
Presentation Transcript
FINANCE January 16, 2013
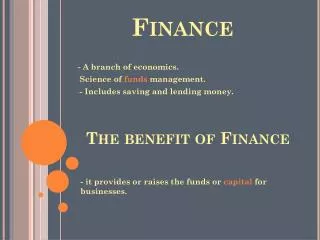
What is Financial Management? Art& Science of managing money
Primary Activities • Financing Decision Raising of funds; amount, sources • Investment Decision Buy assets; fixed assets/projects Current Assets/Working Capital Correlate with risk and uncertainty • Dividend Decision Retain profits (reinvest)/give dividends
Controlling and Monitoring • Stakeholders in a business (Owners, Managers, Regulators, Creditors) are interested in knowing • current status of the business • results of business carried out during a specific period
Basic Accounting Concepts • Business Entity • Money Measurement • Cost; Acquisition cost • Going Concern • Conservative nature • Accounting Period • Matching; revenues and expenses • Materiality • Consistency
Tools for Controlling / Monitoring Annual Reports - Financial Statements • Balance Sheet • Summary of Financial position at a given point of time. • Like a snapshot; list of assets and liabilities • Profit & Loss Statement • Summary of operating results during a period. • Cash Flow Statement • Summary of firms operating, investment and financing cash flows during a period
Working Capital • Investment in various forms of Current Assets • Necessary for smooth and uninterrupted functions of business operations of the firm • Current Assets include: Inventory (Raw Material, Work in Process & Finished Goods), Debtors (Receivables), Advances, Cash • Tradeoff between profitability and liquidity • Gross Working Capital= ∑ (Current Assets) • Net Working Capital = ∑ Sum (Current Assets) - ∑ Sum (Current Liabilities)
Working Capital • Investment in various forms of Current Assets • Necessary for smooth and uninterrupted functions of business operations of the firm • Current Assets include: Inventory (Raw Material, Work in Process & Finished Goods), Debtors (Receivables), Advances, Cash • Tradeoff between profitability and liquidity • Gross Working Capital= ∑ (Current Assets) • Net Working Capital = ∑ Sum (Current Assets) - ∑ Sum (Current Liabilities)
Operating Cycle Cash Receivables Inventory
Operating Cycle Constituents It is sum of 1. Inventory Conversion Period (ICP) Total Time required for producing and selling the product; includes • Raw Material Storage Period (RMSP) • Work in Process Conversion Period (WIPCP) • Finished Goods Storage Period (FGSP) • Average Collection Period (ACP) Time required to collect outstanding amount from customers
Operating Cycle Calculation Gross Operating Cycle (GOC) = ICP + ACP • Actually purchase of Raw Materials on Credit • leads to temporarily postponing payments, source of finance. Payment Deferral Period (PDP) • Time firm is able to delay payments on purchase of various resources Net Operating Cycle(NOC) = GOC – PDP NOC is also called as Cash Cycle
Analysis of Financial Statements Ratio Analysis - widely used tool Makes related information comparable e.g. Net Profit in relation to what? Standards of Comparison • Cross sectional Analysis; competitors ratio or industry ratio • Time series Analysis evaluation of performance over time Classification of Ratios • Liquidity • Activity • Leverage • Profitability
Liquidity Ratios Indicate ability to meet current obligations Current Ratio Current Assets /Current Liabilities It is a test of quantity not quality
Liquidity Ratios Quick (Acid Test) Ratio (Current Assets – Inventories - Loans & Advances) Current Liabilities • Select only Current Assets that can be converted to cash without loss of value • Measure of liquidity when inventory cannot be easily converted to cash
Activity Ratios • Measure firm’s operating efficiency; • Indicates speed with which assets are converted into sales Fixed Assets Turnover Ratio Sales Average Net Fixed Assets • High is better, means better utilization of assets
Inventory Turnover Ratio Inventory Turnover Ratio Sales Average Inventory Average Collection Period 365 days Inventory Turnover Ratio
Debtors Turnover Ratio Debtors Turnover Ratio Credit Sales / Average Debtors Average Collection Period 365 days / Debtors Turnover Ratio • Measures speed with which debtors are converted to cash • High means better management of credit, quality of debtors good
Leverage Ratios • Indicates financial risk and firms ability to use debt to shareholders advantage • Ability to service debts or degree of indebtedness • Indicates mix of funds provided by owners and lenders • The process of magnifying shareholder return through use of debt is called “Financial Leverage”, “Financial Gearing” or “Trading on Equity”
Leverage Ratios Debt Equity Ratio Total Debt Net Worth • High means Risky Investment Interest Coverage Ratio EBIT Interest Charges • Measures ability to meet contractual payments
Profitability Ratios • Profitability in relation to Sales and in relation to Investment Operating Profit Margin Operating Profit (EBIT) Sales • Measure for operating efficiency of the company Net Profit Margin Profit after Tax(PAT) Sales
Profitability Ratios Return on Capital (ROC) Profit before Interest & Taxes (PBIT) Capital Capital= Debt +Equity Return on Equity (ROE) Profit After Tax Net Worth
Some other Measures Earnings Per Share (EPS) Profit after Tax/Number of shares • Profit earned by firm on a per share basis Price/Earnings Ratio(P/E) Market Price of Equity Share/EPS • Measures the amount investors are ready to pay for every rupee of current day earnings • Higher P/E – indicates higher investor confidence