Download
1 / 11
110 likes | 219 Vues
Explore the Graphs of Gene Ontology (GO) Directed Acyclic Graph (DAG) showcasing evidence code usage across various biological processes. This resource highlights critical processes such as Actin cytoskeleton (GO:0015629) for computational evidence and Eye development (GO:0001654) for experimental evidence. Rankings of important biological functions, such as Anatomical structure morphogenesis and responses to biotic stress, are displayed using color gradients to facilitate understanding. Access detailed mappings and coverage reports through our curated data.

E N D
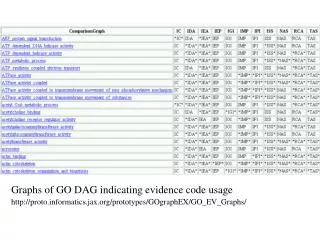
Graphs of GO DAG indicating evidence code usage http://proto.informatics.jax.org/prototypes/GOgraphEX/GO_EV_Graphs/
Actin cytoskeleton GO:0015629 Cooler colors indicate computational evidence
Eye development GO:0001654 Warmer colors indicate experimental evidence
#1 ranked Anatomical structure morphogenesis GO:0009653
#2 ranked Response to biotic stimulus GO:0009607
#18 ranked Embryonic development GO:0009790
#25 ranked Response to stress GO:0006950
Mappings • Biased coverage of GO? • InterPro • SW_KW • Other • Report • ftp://ftp.informatics.jax.org/pub/curatorwork/GO_EV • compare_go_distributions.xls