Download
1 / 16
160 likes | 174 Vues
This research report delves into the complex mechanics of wetland hydrology, focusing on tracer test modeling to determine hydraulic residence time. Various models and data collection methods are explored, revealing trends in velocity and dispersion for different wetland types. Conclusions suggest the need for further study, increased funding for better equipment, and more support for future research. Acknowledgements to advisors, team members, and NSF Grant #EEC-9912319.

E N D
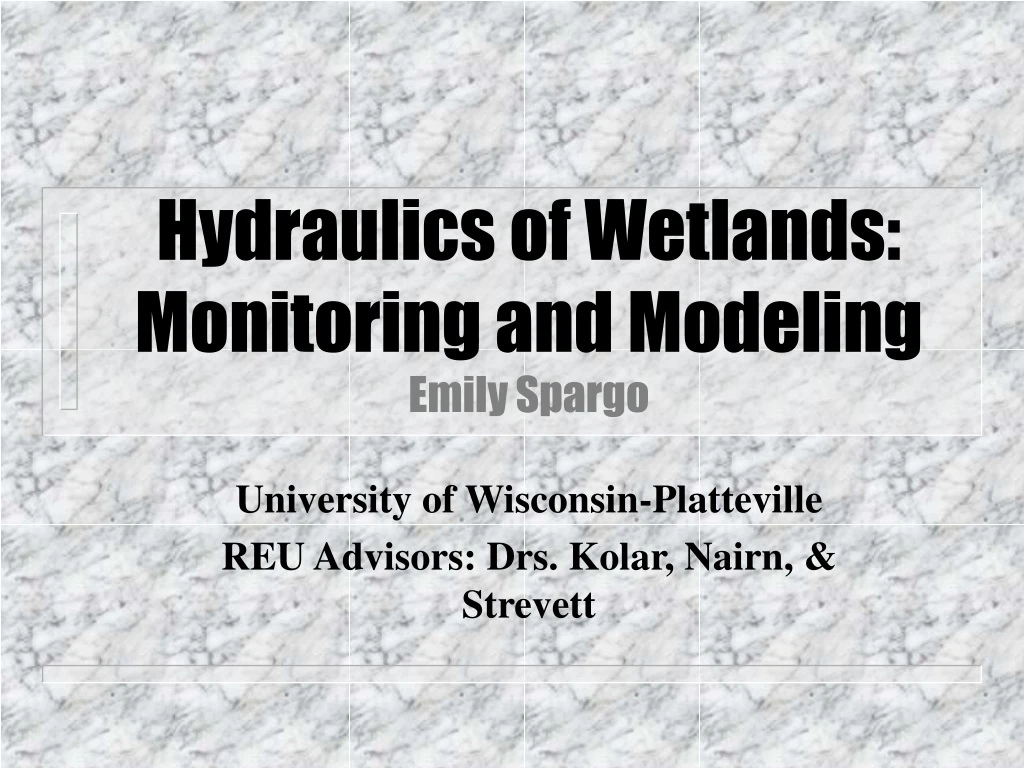
Hydraulics of Wetlands: Monitoring and ModelingEmily Spargo University of Wisconsin-Platteville REU Advisors: Drs. Kolar, Nairn, & Strevett
Report Overview Wetland Hydrology Tracer Test Modeling Conclusions
The Big Question What is the hydraulic residence time of the water moving through the wetland, and how can I most effectively model the flow?
Few Models First in 1970’s Vary for specific type of wetland Complex Systems Inputs Surface & below ground flow Wetland Hydrology ? ? ? ? ?
Tracer Test • Mechanics of a Tracer Test • Input • Sample • Break-through curve • Bromide • conservative • easy to measure • non-toxic
Data Collection & Analysis • 8-day sampling period • Hand and ISCO samples • Bromide Ion Selective Electrode Analysis
Modeling Zero Order Model INPUT OUTPUT BLACK BOX
Modeling First Order Model INPUT OUTPUT Second Order Model INPUT OUTPUT
Our Model • BLACK BOX • Groundwater model • Step Injection • Parameters: • Velocity • Dispersion • Tracer concentration after mixing
Site 1 Field data Model velocity = 0.35 m/min. dispersion coefficient = 0.2 m2/min
Site 2 Field data Model velocity = 0.01 m/min. dispersion coefficient = 0.5 m2/min
Site 3 Field data velocity = 0.001 m/min. dispersion = 3 m2/min. Model Field data Model velocity = 0.001 m/min. dispersion1 = 13 m2/min. dispersion2 = 2.5 m2/min.
Trends: Average velocity decreases Dispersion increases Reasonable trends Residence Times: Site 1 = 25.7 minutes Site 2 = 3.8 days Site 3 = 131.9 days Conclusions ?????
MORE TIME Complete tracer study Increase model complexity MORE MONEY Purchase reliable equipment Increase pay for REU students Future Research
Acknowledgements Dr. Kolar Dr. Nairn Dr. Strevett Denae, Danette, Jake, Jessica, Kim, & Todd NSF Grant # EEC-9912319