Download

1 / 24
240 likes | 358 Vues
This document discusses the significance of integration in building management systems (BMS) to enhance energy monitoring, fault detection, and automated controls for HVAC and electrical loads. It highlights the challenges in data collection and sensor accuracy, emphasizing the need for improved methodologies. Various technologies, including Smart Thermostats and motion sensors, are outlined for reducing energy consumption by up to 28%. Special attention is given to the application of data querying and sharing for real-time decision-making, alongside case studies demonstrating successful implementations.

E N D
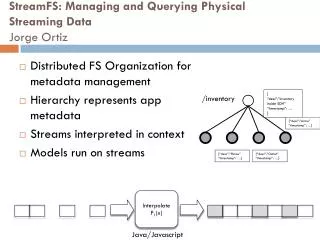
Monitoring and Modelingwith StreamFS Jorge Ortiz University of California, Berkeley
Building energy consumption highly fragmented • Building Management System captures Heat/cooling and ventilation • Lighting systems • Miscellaneous electrical loads • Weather data, price, etc. • Integration is key HVAC: 31.4% + 01/13/11
Why integrate? • Fault detection study[Schein2005] • Fault: Simultaneous heating and cooling • Controllers on separate schedules Heating coil valve Position varies Outside-air mixer Position varies Cooling coil remains off
Integration helps deduceactivity • Human-activity classification • Electrical activity [Patel2007] • HVAC air pressure [Patel2008] • Water usage[Froehlich2008] • IP traffic and circuit-level activity [Kim2010] • SmartThermostat[Lu2010] • Combines motion sensors and contact switches to reduce HVAC energy consumption by 28%
Integration With Current Systems is Hard
Commercial BMS Architecture Applications Routing/Controllers Field Level
Problems with BMS’s • Not designed to collect all the data • Memory limit at control layer, application layer • Most information is lost through sense-point “bundling” (averaging) • Burden on operator to manage • Must decide which signals to “trend/unbundle”, monitor (set trigger) • Leads to missing data in aggregate reports • Multi-signal fault detection done by human operator
The world is a nasty place • State-of-art not designed for data collection • 30% of sensors are broken[BEMS2000] • Mixed air reading errors +2.8 Celsius increases cooling energy consumption by 60% [Kao1983] • Mixed are reading errors -2.8 Celsius increases heating energy consumption by 30% [Kao1983] • Sensor data has fundamental problems • Data missing, variable production rate, calibration necessary, multidimensional, etc [Balazinska2007]
What do we want to achieve? • Generality • Supports the integration of many input/output sources • Ease of use • Add/remove input sources, add/remove output targets • Querying/Cleaning/Sharing the data • Use the metadata to make more informed queries • Organizing principle: Everything looks like a distributed file system • Hierarchy restricts data access through naming • Useful for accessing data according to semantic, categorical, or physical placement
Building multiview integration Environment and Activity /SodaHall /hvac /loadtree /spaces /xform /Chiller /CT /panel /floor4 /floor3 Electrical Load Tree Climate plant
Organizing the metadata r-node {“desc”:”Acme” “timestamp”: …} s-node {“desc”:”Outlet” “timestamp”: …} { “desc”:”inventory inside SDH” “timestamp”: … } {“desc”:”Phone” “timestamp”: …} /inventory {“desc”:”Lamp” “timestamp”: …} /mote123 /SodaHall /power /hvac /loadtree /spaces /xform /Chiller /CT /panel /floor4 /floor3 /outlet /vent
Data collection and querying GET /SDH/spaces/*?query=true&props_metertype=powermeter /inventory/mote123 { “metertype”:”powermeter”, “desc”:”Electric power meter”, “timestamp”: 1290500046 } /par /hum /temp /power PID2 PID1 PID3 PID4 GET ?query=true&ts_timestamp=gt:now-100,ls=now PID4 PID1 PID3 PID2 DB Time
Data representation layer / # list resource under URI root [GET] /data # list sense points under resource data [GET] / [sense_point] # select a sense points [GET] /meter # meters provide this service [GET] / [channel] # a particular channel [GET] /reading # meter reading [GET] /format # calibration and units [GET/POST] /parameter # sampling parameter [GET/POST] /profile # history of readings [GET] /report # create and query periodic reports [GET/POST] sMAP Geographical Water Electrical Occupancy Physical Information Environmental Weather Structural Actuator • Narrow-waist for data representation • Simple Metering and Actuation Profile (sMAP)
RESTful + JSONInterface POST http://is4server.com/is4/devices/ mote123/power?pubid=550e8400 PUT http://is4server.com/is4/devices/mote123/ { "Reading": 120, } { "operation":"create_publisher", "resourceName”:”power" } GET http://is4server.com/is4/devices/ mote123/power REPLY: 201 Created { ”pubid":"550e8400", } { “desc”:”Temperature mote”, "Reading": 120, “timestamp”: 1290500046 } PUT http://is4server.com/is4/devices/mote123/power
Sharing real-time feeds StreamFS mote123/power POST http://is4server.com/sub 550e8400 price { "streams":[550e8400], "url":"http://128.32.37.21:8011/sub.php" } BMS Zigbee 41d4 POST REPLY: 201 Created { ”subid":"41d4", } http://128.32.37.21:8011/sub.php http://is4server.com/sub/41d4
y x y x Standard distillationelements User Consistentuniform view Apply regression; Compute “temp” at grid points Provide regression, interpolation, extrapolation functions over space and time values Provide join and filter functions Related work: MauveDB[Deshpande2006]
Data cleaning and distillation staging Interpolate F1(x) Java/Javascript Extrapolate F2(x) /models /inventory/mote123 /interp /filter /power /current /inventory/mote123/power | /models/interp| /models/filter |http://128.32.37.21:8011/sub.php /proc_chains/983hfq
Model resource example { winsize:10, materialize:true, timeout:2000, func:function(istream){ varostream = new Object(); var sum =0; for(i=0; i<istream.length; i++){ var data = istream[i]; sum += data.Reading; } ostream.points = istream.length; ostream.avg = sum/istream.length; return ostream; } }
Putting it all together(1) GET /…/floor4/room410/*/*?query=true&prop_type=temp /floor4 Interpolate F1(x) Interpolate F1(x) /room410 /mote01 /therm /…/floor4/room410/room410/mote01/temp /…/floor4/room410/room410/therm/temp /temp /temp /…/floor4/room410/room410/mote01/temp?query=true&ts_timestamp=lte:t1,gte:t7 /…/floor4/room410/room410/therm/temp?query=true&ts_timestamp=lte:t1,lte:t7
Putting it all together (2) In-time pipe-chain Continuous pipe-chain t1 /…/floor4/room410/*/*?query=true&type=device | /models/ts_getall?ts_timestamp=lte:t1,gte:t7 |/models/interp_all?attr=timestamp&unit=1 | /models/join?attr=timestamp | http://viewer.com/viewer.php mote01/temp therm/temp t2 t3 t4 t5 t6 t7
Current Status • Live instance on is4server.com • 2795 Incoming data streams • ~600 Kbps incoming data rate • Releases available on the site • Version 2.0 with modeling to be released soon • Documentation and tutorial available on is4server.com • Used in various applications • Electrical load tree viewer, metadata graph viewer, SDH Energy Audit application
Future work • Inter-system cross-signal correlation • Build usage/fault signatures to detect inefficient energy-use detection • How do we expand the use of StreamFS beyond buildings? • Energy analytics • Building blocks available, how do we use it?
Feedback/Questions? Jorge Ortiz <jortiz@cs.berkeley.edu>