Download
1 / 15
150 likes | 251 Vues
Explore the modeling and mapping of underwater monitoring sites in the South Florida/Caribbean Network to track changes in coral cover and species diversity over time. Dive into Dry Tortugas NP's marine resources and 3D models for landmarks like Fort Jefferson. Utilize Thumbs Plus and ArcGIS for data sources and customizing ArcMap.

E N D
Modeling and Mapping Underwater Monitoring Sites Judd Patterson Brian Witcher Lindsay Wieland NPS I&M South Florida/Caribbean Network Miami, FL
Coral Monitoring • Started in 1999 with Virgin Islands-Southern Florida Cluster • Merged into South Florida/Caribbean Network and expanded • Monitor how coral cover and species diversity are changing over time… SFCN I&M
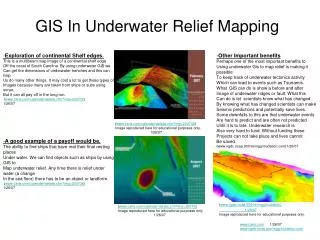
Dry Tortugas NP • ~70 miles to the W of Key West, FL • 64,657 acres (99.8% underwater) • Significant marine resources including well preserved coral reefs • Remote with low visitation (<80,000/yr) SFCN I&M
Journey to DRTO(ArcScene/ArcGlobe) SFCN I&M
The Next Step • Utilize Visual Nature Studio for more complex and visually appealing animations/stills • Render clouds, waves, reflections, atmospheric effects, etc. • 3D models with textures for landmarks such as Fort Jefferson and Loggerhead Key lighthouse – Google Sketchup SFCN I&M
Research Natural Area (RNA) • 46 sq. mile no-take no-anchor preserve • established Jan. 2007 • SFCN goal to compare monitoring data from inside/outside the RNA SFCN I&M
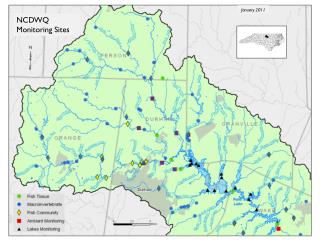
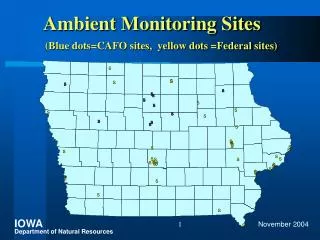
Data Sources • Spatial data – Coordinates for 157 monitoring sites • Tabular data – Field data collected during site visits • Digital photographs – Photo from each cardinal direction (taken at each site) Combine! SFCN I&M
Thumbs Plus SFCN I&M
Thumbs Plus to ArcGIS • Open the Thumbs Plus database in Access (will open despite non-mdb file extension) • Design a query to extract needed data • Establish an ODBC connection to the Thumbs Plus database in ArcCatalog • Add the query to the ArcGIS Table of Contents • Join the query to your spatial features SFCN I&M
Customizing ArcMap SFCN I&M
Customizing ArcMap SFCN I&M
Customizing ArcMap SFCN I&M
Customizing ArcMap SFCN I&M
Attribute info. from a geodatabase From Thumbs Plus database Custom Form SFCN I&M
Thanks!Questions? SFCN I&M