Download
1 / 34
340 likes | 357 Vues
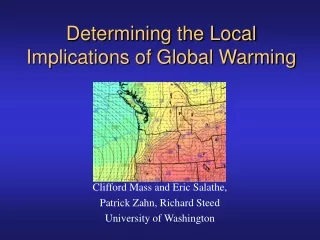
This study examines the local effects of global warming on urban precipitation and flooding in the Puget Sound region. It analyzes historical flooding events and uses regional climate modeling to assess the potential increase in frequency or intensity of such events under global warming.

E N D
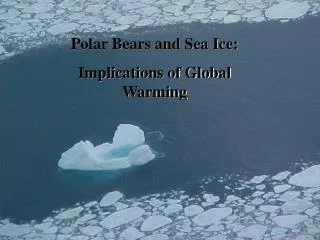
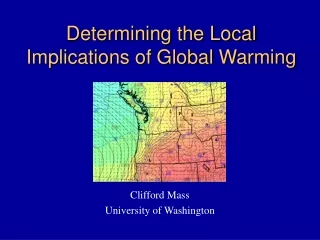
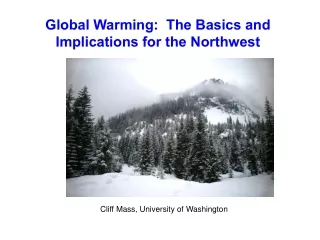
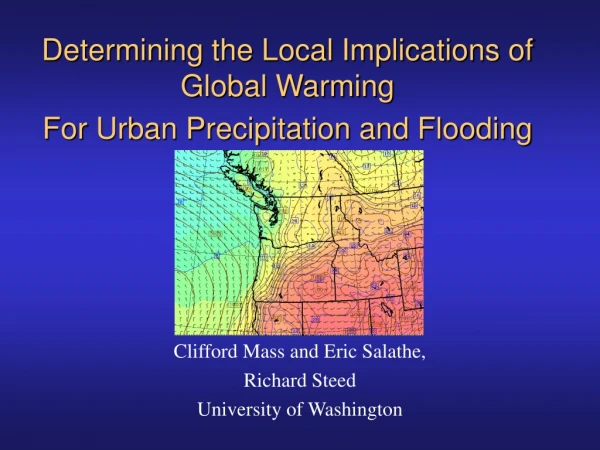
Determining the Local Implications of Global WarmingFor Urban Precipitation and Flooding Clifford Mass and Eric Salathe, Richard Steed University of Washington
Although relatively rare, serious urban flooding does occur in the Puget Sound Region • July 13, 1993: Nearly stationary thunderstorms dumped heavy rain over King and southern Snohomish Counties. • Streets flooded with 1-2 feet of water and several ramps to I-405 closed. • Storm totals: 1-3.5 inches. • A forest service employee reported 3.2 inches in 30 minutes.
December 13, 2006: The Madison Valley Storm Nearly 1 inch in an hour
Do We Expect Such Events to Increase in Frequency or Intensity Under Global Warming? From general principles one could argue BOTH for increasing and decreasing threats.
Increasing or Decreasing Threat? • On one hand, global warming will increase the amount of moisture in the atmosphere, thus potentially causing heavier or more frequent showers. GREATER THREAT • On the other hand, global climate model simulations and recent satellite data suggest that the jet stream…and its associated storms…may move northward with global warming. LESSER THREAT
Regional Climate Modeling • As will be explained in this talk, there is one approach that offers the potential to find the best answer to this important question: • Using General Circulation Models (GCM’s)…global climate models… to drive high resolution regional models capable of simulated local meteorology.
Regional Climate Prediction • To understand the impact of global warming, one starts with general circulation models (GCMs) that provide a view of the global evolution of the atmosphere. • GCMs are essentially the same as global weather prediction models but are run with much coarser resolution and allow the composition of the atmosphere to vary in time (e.g., more CO2) • Even leading GCMs only describe features of roughly 500 km or larger in scale.
Northwest weather is dominated by terrain and land-water contrasts of much smaller scale. • In order to understand the implications of global changes on our weather, downscaling of the GCM predictions considering our local terrain and land use is required.
Model Topography and Resolution MM5 Topo (15 km) GCM: ECHAM5 Topo (150km)
Downscaling • There is only one way to do this right… running full weather forecasting models at high resolution over extended periods, with the large scale conditions being provided by the GCMs….this is called dynamical downscaling. • Such weather prediction models have very complete physics and high resolution, so they are capable of handling any “surprises”
Downscaling • Computer power and modeling approaches are now powerful enough to make dynamical downscaling realistic. • Takes advantage of the decade-long work at the UW to optimize weather prediction for our region.
UW Regional Climate Simulations • Makes use of the same weather prediction model that we have optimized for local weather prediction: the MM5. • 10-year MM5 model runs nested in the German GCM (ECHAM). • MM5 nests at 135 km, 45 km, and 15 km model grid spacing.
MM5 Model Nesting • 135, 45, 15 km MM5 domains • Need 15 km grid spacing to model local weather features.
Regional Modeling • Ran this configuration over several ten-year periods: • 1990-2000-to see how well the system is working • 2020-2030, 2045-2055, 2090-2100
Details on Current Study: GCM • European ECHAM model with resolution roughly equivalent to having grid points spaced ~ 150 km apart. Can resolve features of roughly 600 km size or more. • IPCC climate change scenario A2 -- aggressive CO2 increase (doubling by 2050) IPCC Report, 2001 IPCC Report, 2001
Change in Water Of Snowpack (%)
Precipitation over Western Washington • Bottom Line: No Large Regional Trends in Annual Precipitation • Some seasons gain precipitation (summer/fall), others dry out. • Modest increase in the number of days with heavy rain.
Summary • The viability of the approach…using high resolution numerical prediction models forced by large-scale general circulation climate models (GCMs)… has been demonstrated. • Careful evaluation of the GCM output is required…there are deficiencies, with GCM output and our regional models are not perfect by any means. • Although there is general warming over the region for all seasons, the terrain and land water contrasts of the region enhance or weaken the warming in certain areas.
Summary • Precipitation changes are more modest then temperature changes. • There will be a substantial loss of snow pack, during the next century. • At this point, there does not appear to be a radically increased threat of short-term heavy precipitation leading to urban flooding.
The End The surprise heavy rains in November flooded this intersection in Seattle. (Photo by Casondra Brewster, USGS Seattle District)