Enhancing Multidimensional Data Exploration: Integrating Rank-by-Feature with Hierarchical Clustering
310 likes | 435 Vues
This dissertation investigates the integration of the Rank-by-Feature (RFF) framework with Hierarchical Clustering for effective multidimensional data visualization. It addresses challenges in identifying features, discovering correlations, and analyzing clusters through innovative visualization techniques. By employing the HCE (Hierarchical Clustering Explorer) and adhering to GRID principles (Graphics, Ranking, and Interaction for Discovery), this research aims to enhance data analysis. User surveys and case studies validate the approach, revealing insights into the cognitive challenges of multidimensional data exploration and proposing future developments in the field.

Enhancing Multidimensional Data Exploration: Integrating Rank-by-Feature with Hierarchical Clustering
E N D
Presentation Transcript
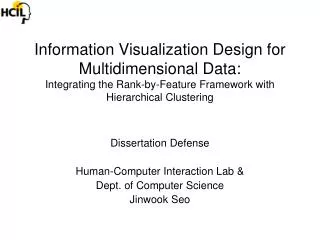
Information Visualization Design for Multidimensional Data:Integrating the Rank-by-Feature Framework with Hierarchical Clustering Dissertation Defense Human-Computer Interaction Lab & Dept. of Computer Science Jinwook Seo
Outline • Research Problems • Clustering Result Visualization in HCE • GRID Principles • Rank-by-Feature Framework • Evaluation • Case studies • User survey via emails • Contributions and Future work
Exploration of Multidimensional Data • To understand the story that the data tells • To find features in the data set • To generate hypotheses • Lost in multidimensional space • Tools and techniques are available in many areas • Strategy and interface to organize them to guide discovery
Constrained by Conventions User/Researcher Conventional Tools Statistical Methods Data Mining Algorithms Multidimensional Data
Boosting Information Bandwidth User/Researcher Information Visualization Interfaces Statistical Methods Data Mining Algorithms Multidimensional Data
Contributions • Graphics, Ranking, and Interaction for Discovery (GRID) principles • Rank-by-Feature Framework • The design and implementation of the Hierarchical Clustering Explorer (HCE) • Validation through case studies and user surveys
Hierarchical Clustering Explorer:Understanding Clusters Through Interactive Exploration • Overview of the entire clustering resultscompressed overview • The right number of clustersminimum similarity bar • Overall pattern of each cluster (aggregation) detail cutoff bar • Compare two resultsbrushing and linking using pair-tree
HCE History • Document-View Architecture • 72,274 lines of C++ codes, 76 C++ classes • About 2,500 downloads since April 2002 • Commercial license to a biotech company (www.vialactia.com) • Freely downloadable at www.cs.umd.edu/hcil/hce
Goal: Find Interesting Features in Multidimensional Data • Finding clusters, outliers, correlations, gaps, … is difficult in multidimensional data • Cognitive difficulties in >3D • Therefore utilize low-dimensional projections • Perceptual efficiency in 1D and 2D • Orderly process to guide discovery
Outliers He Rn
GRID Principles • Graphics, Ranking, and Interaction for Discovery in Multidimensional Data • study 1D • study2D • then find features • ranking guides insight • statistics confirm
Rank-by-Feature Framework • Based on the GRID principles • 1D → 2D • 1D : Histogram + Boxplot • 2D : Scatterplot • Ranking Criteria • statistical methods • data mining algorithms • Graphical Overview • Rapid & Interactive Browsing
Demo A Ranking Example 3138 U.S. counties with 17 attributes Uniformness (entropy) (6.7, 6.1, 4.5, 1.5) Pearson correlation (0.996, 0.31, 0.01, -0.69)
Categorical Variables in RFF • New ranking criteria • Chi-square, ANOVA • Significance and Strength • How strong is a relationship? • How significant is a relationship? • Partitioning and Comparison • partition by a column (categorical variable) • partition by a row (class info for columns) • compare clustering results for partitions
color : Contingency coefficient C size : Chi-square p-value color : Quadracity size : Least-square error
Categorical Variables in RFF • New ranking criteria • Chi-square, ANOVA • Significance and Strength • How strong is a relationship? • How significant is a relationship? • Partitioning and Comparison • partition by a column (categorical variable) • partition by a row (class info for columns) • compare clustering results for partitions
Partitioning and Comparison • Compare two column-clustering results
Partitioning and Comparison • Compare two row-clustering results
Qualitative Evaluation • Case studies • 30-minute weekly meeting for 6 weeks individually • observe how participants use HCE • improve HCE according to their requirements • 1 molecular biologist (Acute lung injuries in mice) • 1 biostatistician (FAMuSS Study data) • 1 meteorologist (Aerosol measurement)
Lessons Learned • Rank-by-Feature Framework • Enables systematic/orderly exploration • Prevents from missing important features • Helps confirm known features • Helps identify unknown features • Reveals outliers as signal/noise • More work needed • Transformation of variables • More ranking criteria • More interactions
User Survey via Emails • 1500 user survey emails • 13 questions on HCE and RFF • 60% successfully sent out • 85 users replied • 60 users answered a majority of questions • 25 just curious users
Which features have you used? Do you think HCE improved the way you analyze your data set?
Future Work • Integrating RFF with Other Tools • More ranking criteria • GRID principles available in other tools • Scaling-up • Selection/Filtering to handle large number of dimensions • Interaction in RFF • Further Evaluation
Future Work • Integrating RFF with Other Tools • More ranking criteria • GRID principles available in other tools • Scaling-up • Selection/Filtering to handle large number of dimensions • Interaction in RFF • Further Evaluation
Contributions • Graphics, Ranking, and Interaction for Discovery (GRID) principles • Rank-by-Feature Framework • The design and implementation of the Hierarchical Clustering Explorer (HCE) • Validation through case studies and user surveys