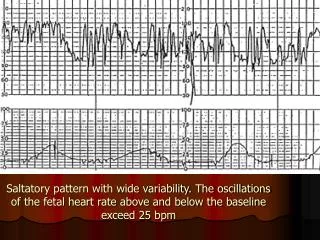
Download
1 / 1
10 likes | 309 Vues
RESULTS Prediction 1. Contrary to this prediction, communities with high proportions of endemic species tended to be species-poor (Figure 2).

E N D
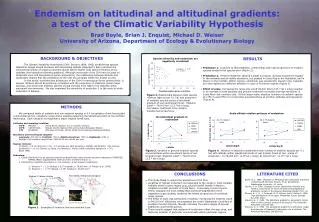
RESULTS • Prediction 1. Contrary to this prediction, communities with high proportions of endemic species tended to be species-poor (Figure 2). • Prediction 2. Percent endemism showed a slight monotonic increase toward the equator in the lowlands and at middle elevations, but peaked in Costa Rica in the highlands, and in Mexico in the foothills. Within regions, endemism was consistently lowest in the lowlands, but was highest at a different elevation in each of the three regions (Figure 3). • Effect of scale. Increasing the range size cutoff 94,000 km2 (2.75 º lat x long) resulted in an increase in both absolute and percent endemism at middle and high elevations in Costa Rica—but nowhere else. At this larger scale, absolute numbers of endemic species at 1750 m and 2750 m in Costa Rica exceeded those at all other latitudes and elevations (Figure 4). Scale effects relative patterns of endemism No latitudinal gradient in endemism A) 2.5 degree scale B) 2.75 degree scale Figure 4. Variation in absolute endemism (mean number of endemic species per 0.1 ha) with latitude within elevational bands of wet tropical forest at two scales of endemism. A) 78,000 km2 (2.5º lat x long); b) 94,000 km2 (2.75 º lat x long). Endemic, 2.5 degree criterion Non-endemic (widespread neotropical) Anthurium concinnatum Lacistema aggregatum. Figure 1. Examples of endemic and non-endemic taxa. Endemism on latitudinal and altitudinal gradients: a test of the Climatic Variability Hypothesis Brad Boyle, Brian J. Enquist, Michael D. Weiser University of Arizona, Department of Ecology & Evolutionary Biology BACKGROUND & OBJECTIVES The Climatic Variability Hypothesis (CVH; Stevens 1989, 1992) predicts that species’ latitudinal ranges should decrease with decreasing latitude (Rapoport’s Rule) and that the increased proximity of range boundaries should lead to higher local species richness at low latitudes (the latitudinal diversity gradient). Although most tests of the CVH have focused on temperate zone and temperate-tropical comparisons, the relationship between latitude and seasonality implies that the predictions of the CVH should apply within the tropics as well. In this study, we tested two predictions of the CVH for neotropical forest communities: 1) species richness should be positively correlated with the proportion of endemics (small range species), and 2) percent endemic species should increase from high to low latitudes within equivalent environments. We also examined the sensitivity of prediction 2 to the scale at which endemism is defined. Species diversity and endemism are negatively correlated Pearson r = -0.57 P < 0.0001 Figure 2. Relationship between local species richness (species per 0.1 ha) and proportion of endemic species across a latitudinal gradient of wet neotropical forest. Endemic cutoff = 78,000 km2 (2.5 º lat x long). Correlation coefficient is for Arcsine-transformed proportions. METHODS We compared totals of endemic and non-endemic species in 0.1 ha samples of wet forest plant communities at four elevations across three localities spanning the latitudinal extent of the northern Neotropics. Each elevation corresponds a major tropical forest type. Latitudes and sampling localities: 18ºN MEXICO Sierra Norte, Oaxaca, to Los Tuxtlas, Veracruz 10ºN COSTA RICA Braulio Carrillo Nationa Park and La Selva Biological Station 1ºN ECUADOR NW slope of Andes, Volcan Chiles to Rio Palenque Biological Station Elevations and forest types sampled: Lowlands: 100-150 m, Foothills: 750 m, Middle elevations: 1750 m, Highlands: 2750 m. Rainfall at all locations ranged from 3500-6000 mm rainfal per year. Species richness: All plants 2.5 cm dbh per 0.1 ha. 1-3 samples per each elevation x latitude combination. Plot sources: Lowlands (n = 4; Los Tuxtlas, La Selva, Rio Palenque), Gentry 1988; remaining samples (n = 37), Boyle 1996. Endemism: 1. Global distribution for all species encountered determined using internet specimen databases (TROPICOS, REMIB, INBio) supplemented with taxonomic literature (Figure 1). 2. Distributions classified as endemic or non-endemic, at two scales of endemism: 1) Endemic = 2.5° latitude x 2.5° longitude ( 78,000 km2; cf. Pitman et al. 1999) 2) Endemic = 2.75° latitude x 2.75° longitud ( 94,000 km2) Figure 3. Variation in percent endemic species across latitude within elevational bands of wet tropical forest. Endemic cutoff = 78,000 km2 (2.5 º lat x long). • CONCLUSIONS • This study failed to uphold the predictions of the CVH • Localities of highest endemism corresponded to the rarest or most isolated habitats within a given region (e.g., pluvial foothill forests in Mexico; isolated mountain summits of Costa Rica). Conversely, humid tropical forest, arguably the most widespread and least-fragmented of the vegetation types studied, harbored the lowest proportions of restricted-range species. • The effect of scale was particularly revealing: increasing the endemic cutoff to 94,000 km2 effectively encompassed the entire Talamancan Cordillera of southern Central America, thereby including the entire ranges of several additional cloud forest species. • These results suggest that patterns of endemism reflect the age, area, and historical isolation of particular environments within particular regions. LITERATURE CITED Boyle, B. L. 1996. Changes on Altitudinal and Latitudinal Gradients in Neotropical Montane Forests. Ph.D. Dissertation. Washington University, St. Louis. Gentry, A. H. 1988. Changes in plant community diversity and floristic composition on environmental and geographical gradients. Annals of the Missouri Botanical Garden 75:1-34. Pitman, N. C. A., J. Terborgh, M. R. Silman, and P. Nuñez V. 1999. Tree distributions in an upper Amazonian forest. Ecology 80:2651-2661. Stevens, G. C. 1989. The latitudinal gradient in geographic range: how so many species coexist in the tropics. The American Naturalist 133:240-256. Stevens, G. C. 1992. The elevational gradients in altitudinal range: an extension of Rapoport's latitudinal rule to altitude. The American Naturalist 140:893-911.