Download

1 / 30
350 likes | 1.31k Vues
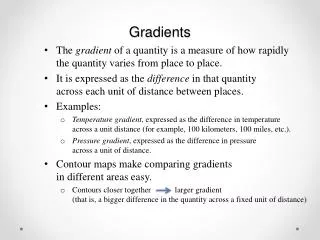
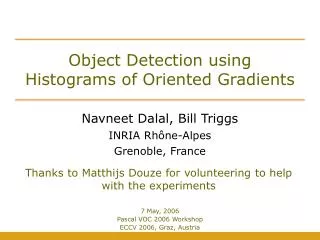
Histograms of Oriented Gradients for Human Detection. Navneet Dalal Bill Triggs INRIA Montbonnot. Marion Millien-Lepine Chamara Jayalath M2R Mosig. Introduction. Human detection based on Histogram Oriented Gradients (HOG). Different approach in using HOGs .

E N D
Histograms of Oriented Gradients for Human Detection NavneetDalal Bill Triggs INRIA Montbonnot Marion Millien-Lepine ChamaraJayalath M2R Mosig
Introduction Humandetectionbased on HistogramOriented Gradients (HOG). Differentapproach in usingHOGs. Extended to otherobjectdetection.
Introduction Challenging task owing to their variable appearance and the wide range of poses. Robust feature set to discriminate the human form.
Outline Previous work Hog Method Dataset and results
Previouswork Papageorgiou’sHaar wavelets as input descriptors. Gavrila & Philomen uses extracting edge images and matching them using chamfer distance Viola moving person detector, using AdaBoost on Haar-like wavelets and space-time differences. And etc………
Outline Previous work Hog Method Dataset and results
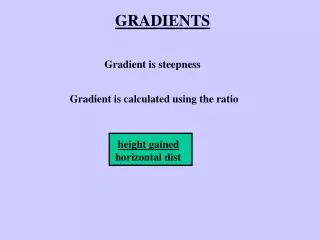
HOG To discriminate the objectformusing gradient orientation. Cell (nxn pixels) Block(t cells)
HOG • Find the edge direction ateach pixel in a cell. • Count occurrences of gradient orientation in cells. • h(θ) = h(θ) +1 ; for the portion • 0 to pi or 0 to 2pi; quantize to N bins • A local histogram for each cell.
HOG • The collectedhistograms of cellscanbeagregated in a defined block • Ex: 0 to 2Pi edge orientations truncated to 16. 4 Cells per Block • Gives 16x4 = 64 features
SIFT and HOG in HumanDetection SIFT uses Oriented Gradients to select the featurevectors >> But local HOG as a dense image descriptor.
Outline Previous work Hog Method Dataset and results
Normalize gamma/colour • Evaluation of several input pixel representations; • Gray Scale • RGB • LAB • No significant performance change >> subseqentnormalizations ? ? • Gray Scalereduces performance • BottomLine: No gamma/colorNormalization
Compute gradient • Evaluation 0f gradient computing; • Gaussiansmoothing (scaleincluding sigma=0) followed by discretederivativemasks ; • [-1 1] uncentered • [-1, 0 ,1] centered • [1,-8,0,8,-1] cubiccorrected • 3x3 sobelmasks • 2x2 diagonal (0 1; -1 0), (-1 0; 0 1) • Usinglargermasksalwaysdecrease performance.
Compute gradient Simple 1-D masks [-1, 0, 1] at sigma=0 work the best.
Spatial/Orientation cells Each pixel calculates a weighted vote for an edge orientation. Votes are accumulated to the orientation bins over cells. Orientation bins are evenlyspacedfrom 0-180
Spatial/Orientation cells • Bilinear interpolation betweenneighbouringbincenters, bothorientaion and position. Ex: if θ=85 degrees. Distance to the bin center Bin 70 and Bin 90 are 15 and 5 degrees, respectively. • Hence, ratios are 5/20=1/4, 15/20=3/4. • Vote is a function of gradient magnitude. • Whyonlyunsignedorientations?
Spatial/Orientation cells Improvementuntil 9 bins
Contrast normalization and descriptor blocks Illumination Variance foreground, background Group the cells in blocks and normalize blocks separately
Descriptor blocks • HOG as global image code. • Cellhistogramsagregated to Blocks. • Blocks are overlapped. • Is itredundant? • Ex: R-HOG • 64x128 image • 16x16 blocks 50% overlapped. • Feature Dimension = 3780
Descriptor blocks • R-HOG • Precise size • Square block • C-HOG • Center divided • Center sample • Same performance • Fine subdivision to workwell
Technics of normalization (Blocks) • L2-norm • L2-Hys • L2-norm, maximize, normalize • L1-sqrt • L1-norm
Technics of normalization (Centered) • Use each cell and its surrounding region • Summed over orientation • Pooled over Gaussian • Performance decreases • Each cell is coded only once in the final descriptor
Detector window 16 pixels margin Decreasingmargindecreases performance
Linear SVM Linear SVM view in previous presentation Few modify to use less memory
Implementation and Performance Analysis • Detector has following properties; • RGB Color space with no gamma correction • [-1,0,1] gradient filter with no smoothing • Linear gradient voting into 9 bins • 16x16 pixel blocks with 4 8x8 pixel cells • Gaussian spatial window with sigma=8 pixels • L2 norm block normalization • Block spacing stride of 8 pixels • 64x128 detection window • Linear SVM classifier
Outline Previous work Hog Method Dataset and results
Dataset selection MIT dataset ‘INRIA’ dataset 200 test images Front or back view City scene Limited range of pose 1805 test images Any orientation Wide variety of background No bias on the pose
Result Identify person in all MIT case Good results in ‘INRIA’ case
Conclusion Different approach of HOG Found parameters to obtain good results Motion information A part based model