Download
1 / 42
450 likes | 846 Vues
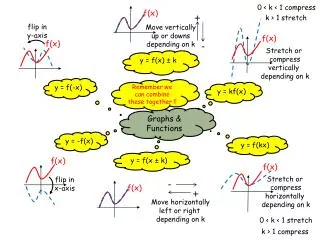
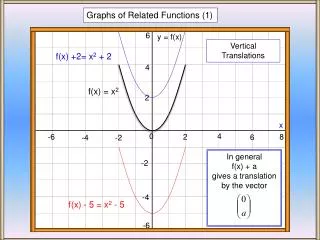
f(x) + a. 6. y = f(x). 4. In general f(x) + a gives a translation by the vector. 2. x. 4. -6. 2. 8. 6. -4. -2. -2. -4. -6. Graphs of Related Functions (1). Vertical Translations. f(x) +2= x 2 + 2. f(x) = x 2. 0. f(x) - 5 = x 2 - 5. 6. y = f(x). 4.

E N D
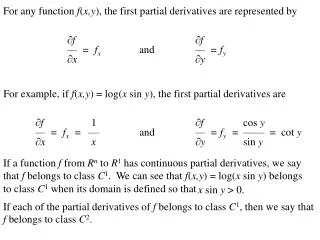
f(x) + a 6 y = f(x) 4 In general f(x) + a gives a translation by the vector 2 x 4 -6 2 8 6 -4 -2 -2 -4 -6 Graphs of Related Functions (1) Vertical Translations f(x) +2= x2 + 2 f(x) = x2 0 f(x) - 5 = x2 - 5
6 y = f(x) 4 In general f(x) + a gives a translation by the vector 2 x 4 -6 2 8 6 -4 -2 -2 -4 -6 Graphs of Related Functions (1) Vertical Translations f(x) + 3 f(x) 0 f(x) - 2
6 y = f(x) 4 2 5 2 f(x - 5) x 4 -6 2 8 6 -4 -2 f(x + 2) -2 In general f(x + a) gives a translation by the vector -4 -6 Graphs of Related Functions (2) Horizontal Translations f(x) 0 In other words, ‘+’ inside the brackets means move to the LEFT
6 y = f(x) 4 5 3 2 x 4 -6 2 8 6 -4 -2 -2 In general f(x + a) gives a translation by the vector -4 -6 Graphs of Related Functions (2) Horizontal Translations f(x - 5) f(?) f(x) 0 f(x + 3) f(?)
Worksheet 1 Grid 1: Sketch or trace (a) f(x) - 4 (b) f(x + 4) (c) f(x - 3) Worksheet 1 Grid 2: Sketch or trace (a) f(x + 4) - 2 (b) f(x - 3) + 1 (c) f(x - 3) - 5 y = f(x) 2 1 y = f(x) f(x) f(x) x x Grid 3: Sketch or trace (a) f(x) + 2 (b) f(x - 3) - 4 (c) f(x + 3) + 3 Grid 4: Sketch or trace (a) f(x) + 3 (b) f(x + 7) + 2 (c) f(x - 3) - 2 y = f(x) 4 y = f(x) 3 f(x) f(x) x x
Worksheet 1 Worksheet 1 Answers Grid 1: Sketch or trace (a) f(x) - 4 (b) f(x + 4) (c) f(x - 3) Grid 2: Sketch or trace (a) f(x + 4) - 2 (b) f(x - 3) + 1 (c) f(x - 3) - 5 y = f(x) 2 1 y = f(x) f(x) f(x) x x Grid 3: Sketch or trace (a) f(x) + 2 (b) f(x - 3) - 4 (c) f(x + 3) + 3 Grid 4: Sketch or trace (a) f(x) + 3 (b) f(x + 7) + 2 (c) f(x - 3) - 2 y = f(x) 4 y = f(x) 3 f(x) f(x) x x
-f(x) 6 y = f(x) 4 2 x 4 -6 2 8 6 -4 -2 -2 -4 -6 Graphs of Related Functions (4) Reflections in the x axis f(x) = x2 - 10x + 25 f(x) = x2 The graph of -f(x) is a reflection of f(x) in the x axis. 0 -f(x) = -x2 -f(x) = -x2 + 10x - 25
6 y = f(x) 4 2 x 4 -6 2 8 6 -4 -2 -2 -4 -6 Graphs of Related Functions (4) Reflections in the x axis f(x) = x2+ 1 f(x) = x2 - 10x + 23 The graph of -f(x) is a reflection of f(x) in the x axis. 0 -f(x) = -(x2 + 1) = -x2 - 1 -f(x) = -x2 + 10x - 23 = -x2 - 1
Graphs of Related Functions (4) 30 y = f(x) Reflections in the x axis 20 f(x) = x3 - 3x2 - 6x + 8 The graph of -f(x) is a reflection of f(x) in the x axis. 10 x 4 -6 2 8 0 6 -4 -2 -10 -f(x) = -x3 + 3x2 + 6x - 8 -20 -30
Graphs of Related Functions (4) 30 y = f(x) Reflections in the x axis The graph of -f(x) is a reflection of f(x) in the x axis. 20 10 f(x) x 4 -6 2 8 0 6 -4 -2 -10 -f(x) -20 -30
Graphs of Related Functions (4) y = f(x) Reflections in the x axis The graph of -f(x) is a reflection of f(x) in the x axis. 2 f(x) = Sinx 1 x -360 90 -90 -180 0 270 180 -270 360 -1 -f(x) = -Sinx -2
Graphs of Related Functions (4) y = f(x) Reflections in the x axis The graph of -f(x) is a reflection of f(x) in the x axis. f(x) = 2Sinx 2 1 x 90 -90 -180 0 -360 270 180 -270 360 -1 -2 -f(x) = -2Sinx
Draw the graph of -f(x) for each case on the grids below. y = f(x) y = f(x) 1 2 f(x) x x f(x) y = f(x) y = f(x) 3 4 f(x) f(x) x x Worksheet 2 Worksheet 2
Worksheet 2 Worksheet 2 Answers Draw the graph of -f(x) for each case on the grids below. y = f(x) y = f(x) 1 2 f(x) x x f(x) y = f(x) y = f(x) 3 4 f(x) f(x) x x
6 y = f(x) 4 2 x 4 -6 2 8 6 -4 -2 -2 -4 -6 Graphs of Related Functions (5) f(-x) Reflections in the y axis f(x) = x2 - 4x + 5 f(x) = x2 + 4x + 5 0 f(-x) The graph of f(-x) is a reflection of f(x) in the y axis. f(-x) = (- x)2 + 4(- x) + 5 = x2 - 4x + 5
Graphs of Related Functions (5) 30 y = f(x) Reflections in the y axis 20 f(x) = x3 - 9x2 + 18x 10 x 4 -6 2 8 0 6 -4 -2 -10 f(-x) = (-x)3 - 9(-x)2 + 18(-x) The graph of f(-x) is a reflection of f(x) in the y axis. -20 f(-x) = -x3 - 9x2 - 18x -30
Graphs of Related Functions (5) 30 y = f(x) Reflections in the y axis 20 f(-x) f(x) 10 x 4 -6 2 8 0 6 -4 -2 -10 The graph of f(-x) is a reflection of f(x) in the y axis. -20 -30
Page 511 Ex E17.3 • A and A* questions • Use a scale of 2 squares in your book = 1 square in the diagram Next lesson (Monday) Transformations of graphs part 2 – stretches. Transformations of sine, cosine Next Thursday & Friday Past paper practice #2 Calculator Paper (bring a calculator)
Draw the graph of f(-x) for each case on the grids below. y = f(x) y = f(x) 1 2 f(x) x x f(x) y = f(x) y = f(x) 3 4 f(x) f(x) x x Worksheet 3 Worksheet 3
Worksheet 3 Worksheet 3 Answers Draw the graph of f(-x) for each case on the grids below. y = f(x) y = f(x) 1 2 f(x) x x f(x) y = f(x) y = f(x) 3 4 f(x) f(x) x x
y co-ordinates tripled y co-ordinates doubled Points located on the x axis remain fixed. Graphs of Related Functions (6) kf(x) 30 y = f(x) Stretches in the y direction 3f(x) 20 2f(x) f(x) 10 x 4 -6 2 8 0 6 -4 -2 0 -10 The graph of kf(x) gives a stretch of f(x) by scale factor k in the y direction. -20 -30
y co-ordinates halved y co-ordinates scaled by 1/3 Graphs of Related Functions (6) 30 y = f(x) 1/3f(x) 20 ½f(x) f(x) 10 x 4 -6 2 8 0 6 -4 -2 0 -10 The graph of kf(x) gives a stretch of f(x) by scale factor k in the y direction. -20 -30
Graphs of Related Functions (6) 30 y = f(x) Stretches in y 3f(x) The graph of kf(x) gives a stretch of f(x) by scale factor k in the y direction. 20 2f(x) 10 f(x) x 4 -6 2 8 6 -4 -2 -10 -20 -30
Graphs of Related Functions (6) y = f(x) 3 Stretches in y 3Sinx 2 2Sinx Sinx 1 x -360 90 -90 -180 0 270 180 -270 360 -1 The graph of kf(x) gives a stretch of f(x) by scale factor k in the y direction. -2 -3
Graphs of Related Functions (6) 3 y = f(x) The graph of kf(x) gives a stretch of f(x) by scale factor k in the y direction. 3Cosx 2 2Cosx ½Cosx 1 Cosx x 360 -360 90 -90 -180 0 270 180 -270 -1 -2 -3
Grid 1: Sketch or trace the graph of 2f(x) Grid 2: Sketch or trace the graph of 3f(x) y = f(x) 2 1 y = f(x) f(x) f(x) x x Grid 3: Sketch or trace the graph of ½f(x) Grid 4: Sketch or trace the graph of 2f(x) y = f(x) 4 y = f(x) 3 f(x) f(x) x x Worksheet 4 Worksheet 4
Worksheet 4 Grid 1: Sketch or trace the graph of 2f(x) Worksheet 4 Answers Grid 2: Sketch or trace the graph of 3f(x) y = f(x) 2 1 y = f(x) f(x) f(x) x x Grid 3: Sketch or trace the graph of ½f(x) Grid 4: Sketch or trace the graph of 2f(x) y = f(x) 4 y = f(x) 3 f(x) f(x) x x
f(kx) 6 y = f(x) 4 2 x 4 -6 2 8 6 -4 -2 -2 ½ the x co-ordinate 1/3 the x co-ordinate -4 -6 Graphs of Related Functions (7) Stretches in x f(2x) f(3x) f(x) 0 The graph of f(kx) gives a stretch of f(x) by scale factor 1/k in the x direction.
6 y = f(x) 4 2 x 4 -6 2 8 6 -4 -2 -2 -4 -6 Graphs of Related Functions (7) Stretches in x f(1/3x) f(x) f(1/2x) 0 The graph of f(kx) gives a stretch of f(x) by scale factor 1/k in the x direction. All x co-ordinates x 2 All x co-ordinates x 3
6 y = f(x) 4 2 x 4 -6 2 8 6 -4 -2 -2 -4 -6 Graphs of Related Functions (7) The graph of f(kx) gives a stretch of f(x) by scale factor 1/k in the x direction. f(1/2x) f(2x) f(x) 0 All x co-ordinates x 1/2 All x co-ordinates x 2
Graphs of Related Functions (7) y = f(x) Stretches in x 2 f(x) = Sinx f(x) = Sin2x 1 x -360 90 -90 360 -180 0 270 180 -270 -1 The graph of f(kx) gives a stretch of f(x) by scale factor 1/k in the x direction. All x co-ordinates x 1/2 -2
Graphs of Related Functions (7) y = f(x) Stretches in x 2 f(x) = Sinx f(x) = Sin3x 1 x -360 90 -90 -180 0 270 180 -270 360 -1 The graph of f(kx) gives a stretch of f(x) by scale factor 1/k in the x direction. All x co-ordinates x 1/3 -2
Graphs of Related Functions (7) y = f(x) Stretches in x 2 f(x) = Cos ½ x f(x)=Cos2x f(x) = Cosx 1 x -360 90 -90 360 -180 0 270 180 -270 -1 The graph of f(kx) gives a stretch of f(x) by scale factor 1/k in the x direction. All x co-ordinates x 1/2 -2 All x co-ordinates x 2
Grid 1: Sketch or trace the graph of f(2x) Grid 2: Sketch or trace the graph of f(3x) y = f(x) 2 1 y = f(x) f(x) f(x) x x Grid 3: Sketch or trace the graph of (a) f(½x) (b) f((1/3)x) Grid 4: Sketch or trace the graph of f(½ x) f(x) y = f(x) 4 y = f(x) 3 f(x) x x Worksheet 5 Worksheet 5
Worksheet 5 Grid 1: Sketch or trace the graph of f(2x) Worksheet 5 Answers Grid 2: Sketch or trace the graph of f(3x) y = f(x) 2 1 y = f(x) f(x) f(x) x x Grid 3: Sketch or trace the graph of (a) f(½x) (b) f((1/3)x) Grid 4: Sketch or trace the graph of f(½ x) f(x) y = f(x) 4 y = f(x) 3 f(x) x x
GCSE Q’s Mark scheme 1. (a) Graph translated 2 units upwards through points(–4, 2), (–2, 4), (0, 2) and (3, 5)Sketch M1 for a vertical translation A1 curve through points (–4, 2), (–2, 4), (0, 2) and (3, 5) ± ½ square (b) Graph reflected in x-axis through points(–4, 0), (–2, –2), (0, 0) and (3, –3)Sketch 2 M1 for reflection in x-axis or y-axis A1 curve through points (–4, 0), (–2, –2), (0, 0) and (3, –3) ± ½ square [4]
GCSE Q’s Mark scheme • (c) Reflection in the y axis 1 mark 3. (a) (4, 3) 1 mark B1 for (4, 3) (b) (2, 6) 1 mark B1 for (2, 6)
4.(a)y = f(x – 4) 2 marks B2 cao (B1 for f(x – 4) or y = f(x + a), a ≠ –4, a ≠ 0) (b) 2 B2 cao(B1 cosine curve with either correct amplitude or correct period, but not both)
Q5(a) 2 B2 parabola max (0,0), through (–2, –4) and (2, –4)To accuracy +/- ½sq (B1 parabola with single maximum point (0, 0) or through(–2, –4) and (2, –4),but not both or the given parabola translated along the y-axis by any other value than -4 – the translation must be such that the points (0, 4), (–2, 0), (2, 0) are translated by the same amount.To ½sq)
2 B2 parabola max (0, 4), through (–4, 0) and (4, 0)To ½sq (B1 parabola with single maximum point (0, 4))To ½sq Q5(b)
f(x) + a 6 y = f(x) 4 In general f(x) + a gives a translation by the vector 2 x 4 -6 2 8 6 -4 -2 -2 -4 -6 Graphs of Related Functions (1) Vertical Translations f(x) = x2 + 2 f(x) = x2 0 f(x) = x2 - 5
6 y = f(x) 4 2 2 x 4 -6 2 8 6 -4 -2 f(x + 2) -2 In general f(x + a) gives a translation by the vector -4 -6 Graphs of Related Functions (2) Horizontal Translations f(x) 0 Inside the brackets, “+” means move the curve _____