Download

1 / 53
530 likes | 579 Vues
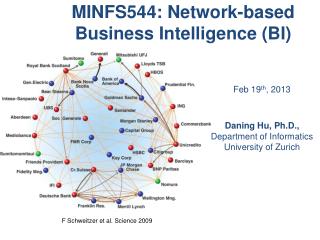
[A Social Network Analysis Suite for Business Intelligence]. Telecom Research & Innovation Centre IBM Research, India. T r iC. SNAzzy. On the Structural Properties of Massive Telecom Graphs: Findings and Implications. Amit A. Nanavati , Siva Gurumurthy, Gautam Das,

E N D
[A Social Network Analysis Suite for Business Intelligence] Telecom Research & Innovation Centre IBM Research, India TriC SNAzzy
On the Structural Properties of Massive Telecom Graphs: Findings and Implications Amit A. Nanavati, Siva Gurumurthy, Gautam Das, Dipanjan Chakraborty, Koustuv Dasgupta, Sougata Mukherjea & Anupam Joshi IBM India Research Lab
The Setting • In Mobile Telecom markets • Competition is ever-increasing • New players • Lower Average Revenue Per User (ARPU) • Customer “churn” • Low barriers to switching providers • Especially in Pre-paid segment • Customer acquisition customer retention • Telecoms must rely on business intelligence • Design the right incentives • Adopt right marketing strategies On the Structure of Massive Telecom Graphs: Findings and Implications
Telescopic view The Setting • Telecom business analytics typically • Analyse only individual customer behaviour • “microscopic view” • Analysing call-graphs • “who-calls-whom” graph • People are the vertices • If two people call each other, there is an edge between their corresponding vertices • How is everyone connected with each other ? • “telescopic view” • May yield major business insights complementaryto traditional mining • Is the graph made up of many small islands ? • High pagerank (social value) can be used in computing customer value On the Structure of Massive Telecom Graphs: Findings and Implications
The Problem • A Call Detail Record (CDR) contains • Telecom business analytics typically • Analyse only individual customer behaviour • “microscopic view” • Analysing call-graphs • “who-calls-whom” graph • People are the vertices • If two people call each other, there is an edge between their corresponding vertices • How is everyone connected with each other ? • “telescopic view” On the Structure of Massive Telecom Graphs: Findings and Implications
Contributions • Studies a broad set of parameters that reveal various structural properties of mobile call graphs. • Novel techniques to determine shape of large graphs • The Treasure-Hunt Model, an edge-distribution based model, probably the first topological model for mobile call graphs. • Attempt to emphasise the practical implications (business insights) of our findings On the Structure of Massive Telecom Graphs: Findings and Implications
Related Work • World-wide web graph model • Power laws in indegree / outdegree • Communities as bipartite cores • Hub, authority, pagerank • “Bow-tie” Model • IN, OUT, SCC (strongly connected component) • Telecom network (AT&T Bell Labs) • Landline phones • Calls made in 1 day • 53 million vertices, 170 million edges • A giant component with 80% of the nodes found • 3.7 million separate components, most of them pairs “bow-tie” On the Structure of Massive Telecom Graphs: Findings and Implications
Powers laws in Telephony and the WWW Aiello et al, AT&T Labs (2000) Kumar et al, IBM Research (2000) On the Structure of Massive Telecom Graphs: Findings and Implications
Data Sources / Preprocessing • The study was done for intra-region calls, and does not include long distance or international calls. • For two of the regions, we collected all the calls made in a week, and for the other two, we collected all the calls made in a month. • Further, very short duration calls (less than 10 seconds) have been ignored as missed calls and wrong calls since they may yield incorrect results. • Multiple calls between any two user or nodes is treated as a single edge. On the Structure of Massive Telecom Graphs: Findings and Implications
Structural Properties • Degree distributions • All parameters quite close • Very few vertices with high in / out degree • Easier to target On the Structure of Massive Telecom Graphs: Findings and Implications
Structural Properties • Degree correlations • Single vertex IN-OUT correlation • Indegree, outdegree correlated upto a point • Beyond that, high outdegree could be salesmen • High indegree micro businesses or highly influential people ? On the Structure of Massive Telecom Graphs: Findings and Implications
Structural Properties • Neighbourhood distribution • Hop exponent • IN(u, h) = | { v: v V, dist(u, v) h } | • N(h) = IN (u, h) • N(h) hH • Int-11-97, Int-04-98, Int-12-98 and Rout-95 with hop exponents 4.62, 4.71, 4.86, 2.83 • Despite differences in numbers of vertices, edges, average degree and time, H is nearly the same • Structurally, they are not different On the Structure of Massive Telecom Graphs: Findings and Implications
doctors patients Structural Properties • Bipartite cores • Community: one set of people calling another set of people,but may not necessarily know each other • Telecom service providers can target communities with appropriate incentives On the Structure of Massive Telecom Graphs: Findings and Implications
Structural Properties • Cliques • Mobile Telecom operators can proactively target cliques with group incentives • Strongly connected components • A giant component exists in all graphs • Sizes of SCCs follow a power law distribution • The largest SCC is significantly larger than the next one • This is similar to the WWW graph On the Structure of Massive Telecom Graphs: Findings and Implications
124801 266894 755592 Shape of call-graphs • “Bow-Tie” analysis • For all regions, the SCC was much bigger than the IN and OUT regions • For WWW, the sizes are nearly the same • 44 million, 56 million (SCC), 44 million • The “Bow-Tie” model does not fit our graphs • Perhaps, another vertex distribution based model • Instead, we found that an edge distribution based model characterises our graphs better On the Structure of Massive Telecom Graphs: Findings and Implications
Shape of call-graphs On the Structure of Massive Telecom Graphs: Findings and Implications
Shape of call-graphs • Finding the shape can be helpful in many ways • Word-of-mouth advertising might work, since the graph is connected • For a new service rollout, the vertices in the Entry and In-Tunnel zones might qualify as better starting points • This provides another way to segment customers On the Structure of Massive Telecom Graphs: Findings and Implications
Thank you! Amit A. Nanavati (namit@in.ibm.com) On the Structure of Massive Telecom Graphs: Findings and Implications
[A Social Network Analysis Suite for Business Intelligence] Telecom Research & Innovation Centre IBM Research, India TriC SNAzzy
Data Mining vs. SNA So far, Individual calling pattern mining when ? how often ? whom ? from where ? Vertical (“tunnel”) mining But, we have a lot of behavioural data that is currently unused who-calls-whom ? how is everyone connected with each other ? how is a new service usage spreading ? What is it that I do not know of my customers today ? Social Network Analysis can do this for you The social network perspective: what also matters is the individual’s location and interactions in the network Telescopic view Microscopic view Microscopic view Telecom Research Innovation Centre Telecom Research Innovation Centre January 3, 2020 20
Construction of the Social Network from CDR data 62 000000002 99 Repeat for millions of rows of CDR data 000000001 171+901 =1072 This visualization shows only part of the social network to be constructed. 000000003 Telecom Research Innovation Centre Telecom Research Innovation Centre January 3, 2020 21
SNAzzy Capabilities Community Finding Closed user groups, Stars, Dense groups Potential Acquisition Target Identification Whom should we target from the competition? Rotational Churn Identification How do we differentiate SIM changers from real churners? Customer Value & Influence Analysis What is the value of this customer? What sort of social influence does he exert? VAS Usage Analysis How is VAS adoption and usage? Is any of the adoption social? Who are the key customers? Churn Prediction and Analysis Social churn: Does Raj churn because his friends do? Telecom Research Innovation Centre Telecom Research Innovation Centre January 3, 2020 23
Churn Prediction & Analysis SNAzzy constructs an influence propagation model: Given persons who churned (initial churners) Diffuse their influence into their social environment Thus, their friends are at a larger churn risk..(The two C1s churn; N does not, since not enough influence) And this propagates to some of their friends’ friends as well.(C2 affected due to indirect, cumulative influence) Output List of predicted churners Business Value Unique model Captures higher order social effects Capture the effect of multiple churners on a subscriber Does not require profile information. Can be applied in post-paid and pre-paid markets as well. Once the model is created, it can be run quickly and often. Complements traditional churn models. Indirect influence Influence spreading C1 * I I * * N C1 C2 I Initial churners (known) Predicted churners C Telecom Research Innovation Centre Telecom Research Innovation Centre January 3, 2020 24
Community Identification | Cliques Closed user groups Everyone knows everyone else People could be members of multiple cliques High school, college, company cliques Output List of cliques with their members identified Clique connectors identified Business Value Telcos can offer automatic discounts for calls within a clique To increase stickiness and loyalty Can be leveraged by SNAzzy churn prediction Telecom Research Innovation Centre Telecom Research Innovation Centre January 3, 2020 25
Community Identification | Stars “Hub” knows the “spokes” Spokes may not know each other Scenarios Hub = buyer ; Spoke = seller (or vice-versa) Hub is someone influential (a minister, celebrity) whom disconnected people are calling Hub is a telemarketeer Hub is a call-centre Output List of stars with the hubs and spokes identified Business Value Telcos can identify call-centres, telemarketeers, and people of high social importance. This is especially useful in prepaid where demographics/profile is not available. Introduces social KPIs to measure the social value of a customer. Can be leveraged by SNAzzy churn prediction. Platinum Customer Regular Customer CDMA Competitor GSM Competitor (from real Telecom data) Telecom Research Innovation Centre Telecom Research Innovation Centre January 3, 2020 26
Community Identification | Dense Communities Dense Communities are hotbeds of social activity A lot of people are talking to a lot of people Figure shows a group of 129 people where everyone knowsand is calling at least 18 others! Output Dense communities and members identified Business Value These communities can be targeted with appropriate calling plans to motivate more calling. (from real Telecom data) Telecom Research Innovation Centre Telecom Research Innovation Centre January 3, 2020 27
Detecting Internal/Rotational Churn Is my churn real? Are people simply discarding old SIMS and replacing them with new ones? Are any new plans cannibalising the existing ones? If it is the same person, then it is likely that he is calling the same set of people with the same set of frequencies. Output List of internal churners (old number, new number) identified. Business Value Helps distinguish between real and internal churn Rajeev Laurent Same person ? Tanveer Dipanjan Telecom Research Innovation Centre Telecom Research Innovation Centre January 3, 2020 28
Potential Acquisition Target Identification Do I know high potential conversion targets from my competition? (a) Competitor subscriber talking to unrelated people in my network. (b) Competitor subscriber talking to friends in my network. (b) is a better target than (a) due to its social connections. Output Ranked list of acquisition targets Business Value Improves hit ratio for acquisition (a) Competitor’s customers (b) - Platinum Customer Regular Customer CDMA Competitor GSM Competitor Potential acquisition targets from competitors (from real Telecom data) Telecom Research Innovation Centre Telecom Research Innovation Centre January 3, 2020 29
Customer Value & Influence Analysis Identify people of high social influence Not just large bill payers Includes people who are called by a lot of people People who are hubs of ‘stars’ Members of many communities “Clique connectors” Output A social importance value for every customer List of viral marketing “seeds” Business Value Potential targets for viral marketing Provides social KPIs to calculate the value of a customer Connectors Platinum Customer Regular Customer CDMA Competitor GSM Competitor (from real Telecom data) Telecom Research Innovation Centre Telecom Research Innovation Centre January 3, 2020 30
VAS Usage Analysis What are the communities that are interested in a particular service? Which products are (not) being bought by communities? People Social Network Things (products, services,…) Who’s buying what ? Telecom Research Innovation Centre Telecom Research Innovation Centre January 3, 2020 31
Thank you! IBM Research, India SNAzzy Contact: Natwar Modani (namodani@in.ibm.com) Amit A. Nanavati (namit@in.ibm.com)
Discovery and analysis of tightly knit communities in telecom social networks Natwar Modani, Kuntal Dey, Sougata Mukherjea, Amit A Nanavati IBM Research – India
In this presentation … • We will talk about 2 topics • How to find large maximal cliques in a graph representing a social network • Analysis of the maximal clique communities in terms of behaviour • How is the behaviour of community members different than the non-community members? • Do people behave differently inside and outside the communities (and in different communities)? • Do communities have characteristics behaviour of their own?
Social Networks • Social networks have existed forever • Many modern social networks can be quantified • As the social interaction data is automatically captured • Example of quantifiable social networks: people to people interaction networks • Online social communities • Emails and instant messenger networks • Telephone call networks • Quantifiable social networks carry social information • Can be analyzed to derive insights • Can be commercially leveraged
Social Network Graphs • Social networks often represented by graphs • A vertex represents an entity (such as, a person) • An edge between a pair of vertices represents a social relationship between the two vertices (such as, familiarity) • Observation: Social network graphs are sparse and follow a power law degree distribution
Communities in Social Networks • Community finding – a long-standing area of interest in Social Network Analysis • Many types of communities defined in literature • Structural property based: E.g., cliques, k-plex, k-cores • Statistical properties based: E.g., dense subgraphs • Graph partitioning based: E.g., CNM method for optimizing modularity
Clique – A Social Community • Cliques are strongly knit communities of multiple vertices • Each vertex belonging to a clique is connected to every other vertex belonging to the clique via an edge • Cliques can viewed as social communities • Example: Telecom social network cliques are social communities • Maximal clique: No superset of the vertices forming the clique forms another clique in the graph
Large Maximal Cliques as Interesting Communities • Smaller clique communities may not be interesting in given contexts • As the minimum desired clique size grows, chances of existence of cliques of at least that size in a random graph decreases • A triangle in a graph stands much higher chance of being formed accidentally compared to a clique of size 5 • Larger cliques carry more social information • As an example of commercial leverage of value, telecom operators may decide to offer call incentives to larger cliques but ignore the smaller cliques • We developed a method well-suited for enumerating all maximal cliques of a given minimum size or above in sparse graphs
Large Maximal Clique Finding: Problem Definition • G = (V, E) – undirected graph • V is the vertex set, E is the edge set • K – a subset of vertices of V – is a clique if for every pair of vertices u, v in K, there is an edge (u, v) in E • We let the user specify a threshold L • The user is interested only in all maximal cliques K such that |K| >= L, where |K| is the number of vertices in K • If there is no set P of vertices such that P is a clique and K is a subset of P, then K is a maximal clique • Problem:Given a simple undirected graph G = (V, E), enumerate all the maximal cliques having a minimum size of L
Phases of the Processing • To enumerate all cliques, we filter the graph to reduce the size, and then enumerate the cliques using our algorithm SELMaC2 • We perform the processing in two steps • The preprocessing • Degree-based filtering (DB filtering) – Filters the graph such that every vertex is guaranteed to have a minimum given degree • Shared Neighborhood Filtering (SNN filtering) – Filters the graph such that every pair of vertices are guaranteed to share a certain number of neighbors • SELMaC2 – our algorithm to find cliques • Novel way of checking maximality – we reuse computation done at previous steps to determine maximality • Cliques are discovered by exploring the neighborhoods of vertices
Settings • We represent the graph in an adjacency list format • The adjacency of a vertex v is defined as G(v) = {v} U {u: (u, v) in E} • Any vertex belonging to the adjacency of a given vertex is referred as a neighbor of the vertex • The adjacency of a given vertex is also said to be its neighborhood
Degree Based Filtering - Overview • Degree-based filtering recursively filters out all vertices below the minimum desired threshold degree from the graph • Loads only the adjacency of one vertex in memory, not the entire graph • Significantly more scalable compared to in-memory approach • Only keeps a list of vertices dropped in a given iteration and in the iteration prior to it in memory • Keeps recursively dropping vertices that fail to meet the minimum degree criteria
SNN Filtering - Overview • Shared Neighborhood Filtering (SNN filtering) evaluates the pairs of endpoint vertices of each edge in the graph • An edge is retained if and only if the endpoint vertices share sufficient number of common neighbors (>= L) • Else, the edge is dropped • A vertex is retained if and only if it has sufficient number of neighbors such that it shares sufficient number of common neighbors with each such neighbor • Else the vertex is dropped • Each edge that is incident on this vertex is also dropped
Behaviour of Communities and its Members • Does the behaviour of community members differ from people who do not belong to communities? • Do community members behave differently towards fellow community members than others? • Is the behaviour of community members different in different communities? • How do communities behave collectively?
Some Terminology • CC: Collection of edges where both ends, that is, the originator and the receiver of the communication, belong to the same community. • CG minus CC: Edges where the originator of the communication belongs to a given community, and the receiver either belongs to one or more different communities or does not belong to any community at all. • CG: Union of CC and CG minus CC. • GC minus CC: Edges where the receiver of the communication belongs to a given community, and the originator either belongs to one or more different communities or does not belong to any community at all. • GC: Union of CC and GC minus CC. • GG minus any C: Edges where neither the originator nor the receiver of the communication for any given edge belongs to any community. • HD40: Edges where either the originator or the receiver of the communication for any given edge has a minimum degree of 40.
Does the behaviour of community members differ from people who do not belong to communities? • Community members more active than those who are not community members • Call duration of community members is shorter than for non-community members • But call frequency is much higher, and hence the average talk time is similar
Does the behaviour of community members differ from people who do not belong to communities? • Community members tend to use SMS with more contacts • The difference is starker for Metro data set
Do community members behave differently towards fellow community members than others? • Community members use SMS more with fellow community members • Call duration of with fellow community members is shorter • But call frequency is much higher, and also the average talk time is much higher
Do community members behave differently towards fellow community members than others? • Community members tend to use SMS with more fellow community members • Here, the behaviour (in terms of ratio) is similar in town and metro