Download
1 / 44
480 likes | 698 Vues
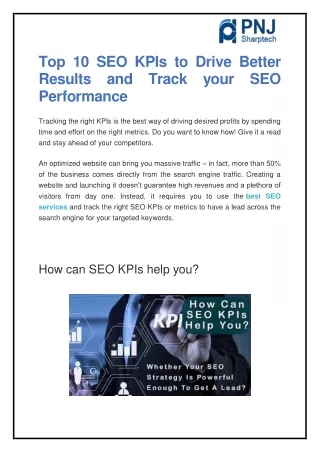
Explore the world of Key Performance Indicators (KPIs) with David Parmenter, a leading expert in performance management. Discover how KPIs can improve performance and drive success in your organization. Dive into the concepts of KPIs, KRIs, and result indicators, and learn how to implement them effectively. This comprehensive guide covers the importance of measuring current and future actions to ensure organizational success.

E N D
Introduction to Winning KPIs Presented by David Parmenter waymark solutions limited August 2009 Website: www.davidparmenter.com Email: Parmenter@waymark.co.nz
A ‘top ten’ performance management book on amazon.com for over two years see www.davidparmenter.com for Amazon link
Are your performance measures improving performance? • performance measures are not working – no balanced scorecard • performance measures are not working – we have a balanced scorecard approach • performance measures areworking - no balanced scorecard • performance measures areworking - we have a balanced scorecard approach
How familiar are you with David Parmenter’s work? • First event, and no familiarity with his work • First live event, but have read his book • Familiar with some of his web casts but not read his book • Familiar with some of his web casts and his KPI book
How many KPIs do you estimate there are in your organisation? • less than 20 • between 21-50 • between 51-100 • over 100
What is the most common timeframe KPIs are reported within? • 24/7 • daily • weekly • monthly • quarterly
The ‘winning KPIs’ webcasts on www.bettermanagement.com • Introduction to winning KPIs (Aug 09) • Implementing KPIs - A 12-Step Process • Implementing KPIs in Smaller Orgs (<200 Staff) • Finding your organization’s critical success factors • Balanced scorecard in 16 weeks not 16 months • Getting started or restarted with winning KPIs • Revitalizing a floundering balanced scorecard with winning KPIs • ‘Winning KPIs’ - a question and answer session • ‘Winning KPIs’ - a question and answer session • “Sorting the wheat from the chaff – finding your wining KPIs
Stories • freight forwarding company • airline
Changing this Team direction Strategic direction
To this Teams in alignment with strategy
4 types of performance measures KRIs peel the skin to find the Ris and PIs PIs&RIs peel to the core to find the KPIs KPIs
How KRIs and KPIs relate to PIs and RIs KRIs RIs PIs PIs RIs PIs PIs RIs PIs PIs KPIs
Key result indicators Examples • net profit movement (EBIT) • customer satisfaction • employee satisfaction • student graduations • return on capital employed
Performance indicators Examples • % increase in sales to the top 10% of customers • # of employees’ suggestions implemented in last 30 days • customer complaints from key customers • sales calls organised for the next week, fortnight • late deliveries to key customers
Result indicators Examples • sales made yesterday • # of products rejected by quality assurance • # of students who have dropped off their course in week • net profit on key product lines • debtor collections in week • bed utilisation in week • speedometer analogy (gear, rpm)
Definition of KPIs KPIs represent a set of measures focusing on those aspects of organisational performance that are the most critical for the current and future success of the organisation
The characteristics of KPIs • non financial (not expressed in Pds, $s, Euros etc) • measured frequently e.g. daily or 24 by 7 • acted upon by CEO and senior management team • all staff understand the measure and what corrective action is required • responsibility can be tied down to the individual or team • significant impact e.g. it impacts most of the core CSFs and more than one BSC perspective • has a positive impact e.g. affects all other performance measures in a positive way
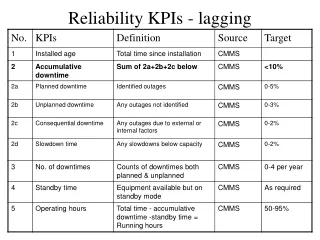
Can be financial and non financial Measures mainly monthly and some times quarterly Ideal for reporting progress to a Board Does not tell you what you need to fix Only person responsible for a KRI is the CEO Designed to summarise activity within one CSF A result of many activities Reported by trend graph Non financial measures (not expressed in $s, Yen, Pds etc) Measured frequently e.g. daily or 24 by 7 Acted upon by the CEO and senior management team All staff understand what corrective action is required Responsibility can be tied down to the individual or team Impacts on more than one of the CSFs Focuses on a specific activity Reported by intranet screen KRIs Vs KPIs
Can be financial and non financial Measured weekly, fortnightly, monthly, some times quarterly Cannot be tied to a team or a discrete activity Does not tell you what you need to do more or less of Designed to summarise some activity within a CSFs/SFs A result of more than one activity Normally reported in a team scorecard Non financial measures (not expressed in $s) Same Tied to a discrete activity, and thus to a team All staff understand what action is required to improve PI Specific activity impacts on one of the CSFs /SFs Focuses on a specific activity Same RIs Vs PIs
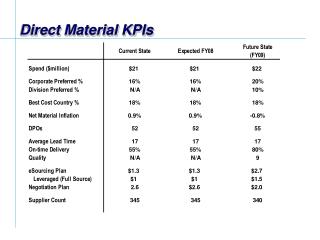
Importance of measuring current and future actions • past measures: e.g. #of late planes last week/ last month • current measures : e.g. planes over 2 hours late • future measure: e.g. # of initiatives to be commenced in the next month / next two months to target areas which are causing late planes
Linkage of strategy to measurement Mission / Vision / Values Financial Results Customer satisfaction Learning & Growth Internal Processes Staff satisfaction Community & environment Key Result Indicators (max 10) Performance and Result Indicators (80 or so) Key Performance Indicators (max 10) Financial Results Customer satisfaction Learning & Growth Internal Processes Staff satisfaction Community & environment Linkage of strategy to KPIs and BSC Strategies (issues & Initiatives) Critical Success Factors KPIs & PIs in a balanced scorecard and KRIs in a dashboard
Critical success factors • “a list of issues or aspects of organizational performance that determine ongoing health, vitality and well-being” source AusIndustry • out of the 30-40 success factors only 5 to 8 will be the critical ones • the missing link to making your performance measures work
The hierarchy of success factors Timely arrival and departure of planes Critical success factors Success factors
The hierarchy of success factors trucks leaving on time as close to 100% capacity as can be Critical success factors Success factors
Most organizations know their success factors - however few organisations have: • worded their success factors appropriately • segregated out success factors from their strategic objectives • sifted through them to find their critical ones – their CSFs • communicated the CSFs to staff • see my webcast on finding your CSFs
Up to 10 key result indicators Dashboard (sent e.g. ROCE, new business to the Board) growth, customer satisfaction Weekly reporting on the Monthly reporting on the remaining KPIs Management's PIs and RIs balanced scorecard 24/7 or 9am report on the Monthly financials, and KPIs (e.g. British BSCs from business information Airways' late planes) units, corporate service units (IS, HR etc) How they fit together
24 by 7 reporting • intranet based • contact details of follow-up by CEO, SMT etc. • enough details for staff and management to action
Monthly summary of operations Daily / weekly KPI reports Monthly Team scorecards Board Teams SMT/ Ops SMT SMT/ Ops Weekly Team rpt Staff
Suggested next steps • read my articles on www.bettermanagement.com • acquire my whitepapers and templates from www.davidparmenter.com • buy the book “Key Performance Indicators – developing, implementing and using winning KPIs” • engage PR expert to help sell concept • deliver a presentation to the SMT – see ‘Getting started or restarted with winning KPIs’ webcast • review www.davidparmenter.com for new material • link with an external expert to run the CSFs workshop
These books came out in 07 www.waymark.co.nz to order, see link to www.amazon.com
John Wiley & Sons have published Amazon link on www.davidparmenter.com