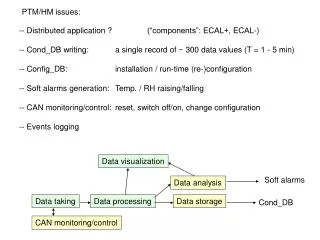
ECAL status
ECAL status. Pit activities summary; PM and R/O cells status; LED monitoring system status; Gain by photo-statistics; Plans / requests;. 22 Sept 2008. Pit activities summary. 8 Sept: all patches are installed; 17 Sept:

ECAL status
E N D
Presentation Transcript
ECAL status Pit activities summary; PM and R/O cells status; LED monitoring system status; Gain by photo-statistics; Plans / requests; 22 Sept 2008
Pit activities summary • 8 Sept: all patches are installed; • 17 Sept: - one malfunctioning patch is replaced. Now corresponding line does not show dependence on MV; - another patch on one line with ratio A(MV=60) / A(MV=80) higher than one is replaced. Nothing changed; • - 12 LEDs which showed no signal according to PMs (e.g. run 33503) are checked with oscilloscope (see below); • - several data samples are collected afterwards (see slides below + appendix);
Ratio LED amp (MV = 60V) / LED amp = 80V): 2d PATTERN OF LINES WITH R > 1 is reproduced ! Line with R > 1, patch has been changed Bad patch R=LED amp(60V) / LED amp (80V), before access R = LED amp(60V) / LED amp (80V), after access
Ratio LED amp (MV = 60V) / LED amp = 80V): 1d INNER MIDDLE OUTER On average - R is ~1; (pay attention, that Y-scale is logarithmic)
R.M.S. of LED signals NO SIGN OF NOISY LINES There are several cells with r.m.s., higher than in neighboring cells – to be checked LED peak r.m.s., ADC counts
ECAL cells-I • 5 candidates: breakdown of capacitance on C-W. To be checked according to the consumption from MV source. All belong to A-side – could be result of last weeks exercises with ECHVA project / LEDs switched ON at cosmic gains / … / etc • + 7 more cells with absent LED signal - 3 cells: narrow pedestal distribution, no C-W noise ( M 11/28; M 59/31; O 39 / 11 ) – absent contact? - 4 cells: C-W noise is OK ( O 24/44; M 12/31; I 20/45; I 45/22) • Cosmic data: got the impression that some cells, which have to be masked, are actually not! (mostly on A-side). Anatoly, could you please cross-check?
ECAL cells-II Reference plot: White color: cells which are currently masked in DB (HV is set to zero) (answer to Patrick’s question)
LED system: status-I • 12 LEDs checked during the last access (just start DAQ and plug the oscilloscope to the output of PIN diode): • - 4 LEDs of the group A105 - all signals are OK by scope, ergo this is problem with time alignment • - 4 LEDs of the group A103 - all signals are OK, ergo this is problem with time alignment • - 1 LED A202.3 - bad quality of the cable, delivering LED fire signal inside LED box. Now LED is working, but connection has to be repaired if there will be an opportunity (not urgent) • - 1 LED C309.1 - OK by scope • - 2 LEDs C301.1 and C301.3 - broken connection between HV box and flat power distribution cable, fixed, signal from both LEDs are OK by scope • In the last data: groups A105; A103 and LEDs C309.1 are still missing. Also: no readings from C3.20.3! • Suggestion is the following: take one more LED sample but only after recipes for readout part (LEDTSB, FEBs) are checked and finalized. If after that some LEDs will appear missing, we will request access and check them once again with the scope.
LED system: status-II Current LED intensity settings for operational LEDs: more-or-less reasonable after first iteration. Next iteration (data are collected and processed): final fine tuning. Response on LED, ADC counts
LED system: time alignment Prev1 T0 Next1 ??? seems to be lost…
Calibration of the gain by photostatistics A = k * G * N(p.e.) * e / s(adc) N(p.e.) = f *(A/σ)² (number of photoelectrons) e – electron charge; s(adc) = 0.0195 pC/ADC count; f = 1.2 (Fano factor); k = 1/3 (clipping coeff); A is LED peak position; σ is LED peak sigma; G = 304688 * σ² / A Limiting factors: a) contribution from the photostatistics should dominate other possible sources. Natural strategy is to decrease the intensity of the LED light as much as possible increasing simultaneously the gain of phototubes BUT… b) even at zero intensity settings many ECAL LEDs produce residual light. It is not seen by pototubes at nominal gain settings, while, for example, at cosmic gains response on LEDs for many phototubes is high enough to saturate ADC
Calibration of the gain by photo-statistics (cont) Several samples at different settings: Gain 100K, 150K, 200K LED intensities: 0.1V; 0.2V; 0.3V Cells, accepted for analysis: > 90% of signal in one BX; signal is not saturated; After gain change: ~10 minutes of “warming-up” under LED illumination (56 Hz); Only last 5000 events out of 20K collected are used in the analysis;
Calibration of the gain by photo-statistics (cont) INNER MIDDLE OUTER Expected gain is 100K !
Calibration of the gain by photo-statistics (cont) Still: about 30% - 40 % difference ( ~5-6% in terms of PM HV)
Calibration of the gain by photo-statistics: some remarks 1) PIN distribution – seems to be narrow (though signal values are very small, can be not signals but cross-talk…) 2) Absolute gain value is somewhat undefined due to dependence of C-W output on LV, but: - when we measured directly output HV on one C-W base in the wall with / without patch installed, the measured value in the presence of patch was exactly equal to the expected one May be, lab studies on the future test-bench will clarify the situation
Requests / plans Request: restore LED /PIN system timing ASAP ECAL detector activity: Check 5 cells with capacitance breakdown + Long term LED stability run; -------------------------------------------------- Major work is now in the lab (C-W modification related activity);
Appendix: data samples Reference: #33907: nominal HV, nominal LED LV, 20K of events; 56Hz LED trigger rate #33912…33925 LED intensities scan; nominal HV, 20K of events; 56Hz LED trigger rate Data for different gain settings: #33931 Gain 100K; LED LV = 0.1V; 20K; 56Hz #33936 Gain 100K; LED LV = 0.2V; 20K; 56Hz #33937 Gain 100K; LED LV = 0.3V; 20K; 56Hz #33939 Gain 150K; LED LV = 0.1V; 20K; 56Hz #33940 Gain 150K; LED LV = 0.2V; 20K; 56Hz #33942 Gain 150K; LED LV = 0.3V; 20K; 56Hz #33946 Gain 200K; LED LV = 0.1V; 20K; 56Hz #33947 Gain 200K; LED LV = 0.2V; 20K; 56Hz #33948 Gain 200K; LED LV = 0.3V; 20K; 56Hz Time scan: #33950: nominal HV, nominal LED LV; 56 Hz; 26 steps / 800 evt per step