Download
1 / 28
280 likes | 495 Vues
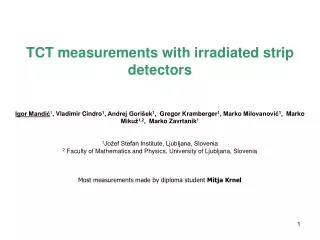
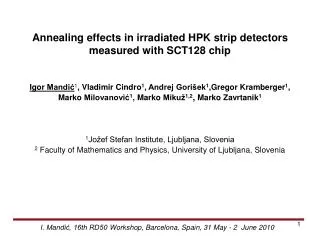
TCT measurements with SCP slim edge strip detectors Igor Mandić 1 , Vladimir Cindro 1 , Andrej Gorišek 1 , Gregor Kramberger 1 , Marko Milovanović 1 , Marko Mikuž 1,2 , Marko Zavrtanik 1 1 Jožef Stefan Institute, Ljubljana, Slovenia

E N D
TCT measurements with SCP slim edge strip detectors Igor Mandić1, Vladimir Cindro1, Andrej Gorišek1,Gregor Kramberger1,Marko Milovanović1, Marko Mikuž1,2, Marko Zavrtanik1 1Jožef Stefan Institute, Ljubljana, Slovenia 2 Faculty of Mathematics and Physics,University of Ljubljana, Slovenia I. Mandić, 22nd RD50 Workshop, Albuquerque, NM, USA, 3-5 June 2013
Introduction: • Scribe - Cleave - Passivate (SCP) slim edge strip detectors • p-type strip detectors from CiS, pitch 80 µm, Vfd ~ 50 V • SCP(alumina) processed by Santa Cruz • TCT measurements with focused laser light: • 1) IR light beam directed on the surface of strip detectors • measure charge collection across the detector surface • 2) red laser beam directed on the cleaved side of the strip detector • probe electric field on the cleaved edge surface • measure before and after irradiation with neutrons in reactor in Ljubljana I. Mandić, 22nd RD50 Workshop, Albuquerque, NM, USA, 3-5 June 2013
Scribing CleavingPassivation (SCP) method to reduce the inactive area of sensors [V. Fadeyev, 20th RD50 Workshop, Bari, 2012] Laser or XeF2 etching tweezers or automated cleaving machine n-type: oxide p-type: Al2O3with ALD I. Mandić, 22nd RD50 Workshop, Albuquerque, NM, USA, 3-5 June 2013
Detectors: • measurements with 3 strip detectors • SCP cut at different distance from the edge 3 guardrings ~ Edge: 220 µm Det 0 guardringcut Det 3 ~ 180 µm guardringcut ~ 110 um Det 4 I. Mandić, 22nd RD50 Workshop, Albuquerque, NM, USA, 3-5 June 2013
Standard focused laser TCT Setup detector HV Peltier controller beam diameter in the silicon FWHM < 7 mm y table optical fiber & focusing system Cooled support Detector box width of light pulses ~ 100 ps , repetition rate 500 Hz cooling pipes z table x table Bias-T 1GHz oscilloscope fast current amplifier Laser Laser driver trigger line I. Mandić, 22nd RD50 Workshop, Albuquerque, NM, USA, 3-5 June 2013
Connection • only bias ring bonded • measure signals induced on bias ring HV I. Mandić, 22nd RD50 Workshop, Albuquerque, NM, USA, 3-5 June 2013
IR laser, scan top surface Bias R GR Strips direction of scan • Det 3: edge ~ 180 µm • Det 4: edge ~ 110 µm • same CCE near strips • for both detectors Cut Cut Bias 50 V I. Mandić, 22nd RD50 Workshop, Albuquerque, NM, USA, 3-5 June 2013
Strips IR laser, scan top surface Bias R • the outermost guard ring • also bonded for Det 0 • measurement • Det 0: scan over area • with wider bias-ring metal SCP edge Det 3, Det 4 Det 0 Det 0: edge ~ 220 µm Det 3: edge ~ 180 µm Det 4: edge ~ 110 µm same CCE at strips! Cut 50 V I. Mandić, 22nd RD50 Workshop, Albuquerque, NM, USA, 3-5 June 2013
IR laser, scan top surface, irradiated detector Scan with IR laser over detector on the SCP cut side and on the standard side bias ring Standard side Cut side strips Cut Det 0 Φ = 1e14, 50 V Cut doesn’t change CCE near strips I. Mandić, 22nd RD50 Workshop, Albuquerque, NM, USA, 3-5 June 2013
IR laser, scan top surface, irradiated detectors Φ = 1e14, 50 V Det 0 Det 3, Φ = 1.5e15, 500 V • negligible difference between cut • and not-cut side after irradiation Det 4 Φ = 1e14, 240 V I. Mandić, 22nd RD50 Workshop, Albuquerque, NM, USA, 3-5 June 2013
Edge scan with red laser (preliminary!) • Red light enters ~ 3 µm into Si • probe the E field at the cleaved edge surface • similar to STCT measurements with CTS edgeless detectors (TOTEM) • (see e.g. E. Verbitskaya et al., NIMA 604 (2009) p. 246) HV y = 0 y Laser 295 µm SCP edge • electric field higher closer to the top (y = 0) • at larger y carriers enter the field region by diffusion long pulses • similar pulses in all 3 detectors no large effects of edge thickness I. Mandić, 22nd RD50 Workshop, Albuquerque, NM, USA, 3-5 June 2013
Electricfield profile: induced current at t ~ 0 proportional to carrier velocity at laser spot location electric field profile (only approximatelly because Ewis not constant) • at higher bias stronger field at larger distance from electrode • also at 150 V >> Vfd weak field near the back side I. Mandić, 22nd RD50 Workshop, Albuquerque, NM, USA, 3-5 June 2013
Simulation from: Marc Christophersen, “6th Trento Workshop”,March 2-4, 2011 No surface charge: Negative charge (-1E11 cm-2) : n-strip Al2O3 n-strip Not considering surface charges leads to wrong potential distribution at sidewall. low field at the back side because of surface charge I. Mandić, 22nd RD50 Workshop, Albuquerque, NM, USA, 3-5 June 2013
Edge scan with red laser • measurements at higher voltages ( V >> Vfd ~ 50 V) Det 0, (220 µm edge) Bias = 450 V • electric field all over the cleaved edge I. Mandić, 22nd RD50 Workshop, Albuquerque, NM, USA, 3-5 June 2013
Currentbeforeandafterirradiation • Det 3: 1e14, Det 0: 5e14, Det 3: 1.5e15 • detectors annealed for 80 minutes at 60°C • calculation: I = α·Φ·V; Vfrom depleted depth in pad geometry T = 20 C Irradiated • -higher bias couldbeappliedafter irradiation • no large difference between measured and bulk current after irradiation I. Mandić, 22nd RD50 Workshop, Albuquerque, NM, USA, 3-5 June 2013
Pulses before and after irradiation after irradiation long pulses not seen because of trapping I. Mandić, 22nd RD50 Workshop, Albuquerque, NM, USA, 3-5 June 2013
Field profiles before and after irradiation Φ = 0 Vfd = 1900 V wdep(500 V) = 140 µm Double junction • depleted depth in planar diode: • after irradiation to 1.5e15 E field on the edge extends closer to value of wdep I. Mandić, 22nd RD50 Workshop, Albuquerque, NM, USA, 3-5 June 2013
Depthof field at the edge • measurement: max. yat which E > 0 (from field profile measurement) • calculation: depletion depth in planar geometry • measured and calculated values closerat higher fluences • after irradiation to high fluences field at the edge similar as in the bulk I. Mandić, 22nd RD50 Workshop, Albuquerque, NM, USA, 3-5 June 2013
Summary • CCE measurements with focused IR laser light • no influence of cut edge on CCE at strips before or after irradiation • measurements with focused red laser light • nice tool to probe electric field on the edge surface • lowerelectric field on the edge at the back side of the detector • in agreement with simulations • after irradiation: • indication that field on the edge more similar to thefield in the bulk I. Mandić, 22nd RD50 Workshop, Albuquerque, NM, USA, 3-5 June 2013
Scans at different voltages Vfd ~ 40 V Det 3 Det 0 Det 4 I. Mandić, 22nd RD50 Workshop, Albuquerque, NM, USA, 3-5 June 2013
CCE scans at 50 V beforeandafterirradiation Det 0 Bias = 50 V I. Mandić, 22nd RD50 Workshop, Albuquerque, NM, USA, 3-5 June 2013
IR laser, scan top surface Det 3, Φ = 0 Det 4, Φ = 0 I. Mandić, 22nd RD50 Workshop, Albuquerque, NM, USA, 3-5 June 2013
Edge scan with red laser Pulses: • Edge thicknesses: • Det 0 ~220 um • Det 3 ~180 um • Det 4 ~110 um • similar pulses • weakfield at back side ? Light on top, detector not at 90 deg? I. Mandić, 22nd RD50 Workshop, Albuquerque, NM, USA, 3-5 June 2013
Profiles before irradiation I. Mandić, 22nd RD50 Workshop, Albuquerque, NM, USA, 3-5 June 2013
Pulses before and after irradiation • maximum bias for this detector • after irradiation to 1e14 50 V • could go to 100 V after 5e14 • depletion depths: • 1e14, 50 V: ~150 µm • 5e14,100 V: ~100 µm I. Mandić, 22nd RD50 Workshop, Albuquerque, NM, USA, 3-5 June 2013
Pulses before and after irradiation detector not well aligned, light on top? I. Mandić, 22nd RD50 Workshop, Albuquerque, NM, USA, 3-5 June 2013
Field profiles before and after irradiation Vfd= 170 V Vfd = 1900 V wdep(500 V) = 140 µm Double junction? I. Mandić, 22nd RD50 Workshop, Albuquerque, NM, USA, 3-5 June 2013
I. Mandić, 22nd RD50 Workshop, Albuquerque, NM, USA, 3-5 June 2013