Download
1 / 27
270 likes | 424 Vues
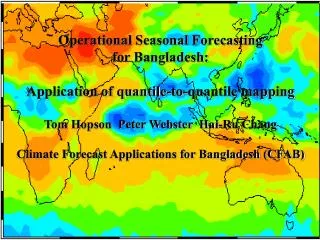
Operational Seasonal Forecasting for Bangladesh: Application of quantile-to-quantile mapping Tom Hopson Peter Webster Hai-Ru Chang Climate Forecast Applications for Bangladesh (CFAB). Overview: Seasonal forecasting. Quantile-to-Quantile Mapping: seasonal forecasting of

E N D
Operational Seasonal Forecasting for Bangladesh: Application of quantile-to-quantile mapping Tom Hopson Peter Webster Hai-Ru Chang Climate Forecast Applications for Bangladesh (CFAB)
Overview: Seasonal forecasting Quantile-to-Quantile Mapping: seasonal forecasting of precipitation and river discharge What leads to good discharge forecast skill? Precipitation products IV. Quantile-to-Quantile Mapping: shortterm forecasting of precipitation V. A warning about using Probabilistic Precip Forecasts in Q modeling (or: Importance of Maintaining Original Ensemble Spatial and Temporal Covariances)
Three-Tier Overlapping Forecast SystemDeveloped for Bangladesh SEASONAL OUTLOOK: “Broad brush” probabilistic forecast of rainfall and river discharge. Updated each month. Produced out to 6 months, currently most useful skill out 3 months 20-25 DAY FORECAST: Forecast of average 5-day rainfall and river discharge 3-4 weeks in advance. Updated every 5 days. 1-10 DAY FORECAST: Forecast of rainfall and precipitation in probabilistic form updated every day. Considerable skill out to 5-days. Moderate skill 5-10 days.
Utility of a Three-Tier Forecast System SEASONAL OUTLOOK: Long term planning of agriculture, water resource management & disaster mitigation especially if high probability of anomalous season (e.g., flood/drought) 20-25 DAY FORECAST: Broad-scale planning schedules for planting, harvesting, pesticide & fertilizer application and water resource management (e.g., irrigation/hydro-power determination). Major disaster mitigation resource allocation. 1-10 DAY FORECAST: Detailed agriculture, water resource and disaster planning. E.g., fine tuning of reservoir level, planting and harvesting.
Quantile-to-Quantile Approach to Remove Biases: applied to Seasonal Forecasts of Precipitation and Discharge 1) Precipitation: mapped to historic observed precipitation cumulative PDF’s -- Brahmaputra, Ganges, and combined catchment-average values -- done independently on 1-mo, 2-mo, …, 6-mo forecasts Discharge: -- precipitation forecast cumulative PDF’s mapped to observed historic discharge cumulative PDF’s (similar approach used for 1 - 10 day forecasts)
Quantile to Quantile Mapping For 1-, 2-, …, 6-month Precipitation Forecasts Model Climatology “Observed” Climatology Pmax Pmax Precipitation Pfcst Padj 25th 50th 75th 100th 25th 50th 75th 100th Quantile Quantile
Quantile to Quantile Mapping For 1-, 2-, …, 6-month Discharge Forecasts Model Precip Climatology “Observed” Q Climatology Pmax Pmax Precipitation Pfcst Padj 25th 50th 75th 100th 25th 50th 75th 100th Quantile Quantile Optimal correlation: Brahmaputra discharge 11-day lagged; Ganges discharge: 21 day lagged
The Climate Forecast Applications Project CFAB Good forecasting skill derived from: 1) Spatial scale of the basins 2) Satellite-raingauge estimates 3) ECMWF forecast skill 4) Partnership with FFWC/IWM => Utilize good quality daily border discharge measurements near-real-time
1) Spatial Scale -- Increase in forecast skill (RMS error) with increasing spatial scale -- Logarithmic increase
2) Precipitation Estimates Rain gauge estimates: NOAA CPC and WMO GTS 0.5 X 0.5 spatial resolution; 24h temporal resolution approximately 100 gauges reporting over combined catchment 24hr reporting delay Satellite-derived estimates: Global Precipitation Climatology Project (GPCP) 0.25X0.25 spatial resolution; 3hr temporal resolution 6hr reporting delay geostationary infrared “cold cloud top” estimates calibrated from SSM/I and TMI microwave instruments 3) Satellite-derived estimates: NOAA CPC “CMORPH” 0.25X0.25 spatial resolution; 3hr temporal resolution 18hr reporting delay precipitation rain rates derived from microwave instruments (SSM/I, TMI, AMSU-B), but “cloud tracking” done using infrared satellites
Comparison of Precipitation Products: Rain gauge, GPCP, CMORPH, ECMWF
Good comparison for all products at large spatial scales
ECMWF Ensemble Precipitation Forecast Adjustments -- mapping forecasts from “model-” to “observational-”space Brahmaputra Catchment-avg Forecasts • Hydrology model initial conditions driven by near-real-time GPCP / CMORPH / Raingage precipitation • Ideally, observations would be statistically “just another ensemble member” • Approach: calculate historical NWP-climatology PDF and observation-climatology PDF for each grid using a “kernel” method • For each forecast ensemble, determine its quantile in model-space and extract equivalent quantile in observation-space
Quantile to Quantile Mapping Done independently for 1-, 2-, …, 10-day forecasts Model Climatology “Observed” Climatology Pmax Pmax Precipitation Pfcst Padj 25th 50th 75th 100th 25th 50th 75th 100th Quantile Quantile
Point: Mapping preserves the spatial (and temporal) features of the precipitation forecast fields (i.e. preserves the spatial and temporal covariances)
Rank Histogram Comparisons Original Adjusted
ECMWF Ensemble Precipitation Forecast Adjustments -- mapping forecasts from “model-” to “observational-”space Brahmaputra Adjusted Forecasts • Benefits: --Gridded “realistic” forecast values --spatial- and temporal covariances preserved • Drawbacks: --limited sample set for model-space PDF (2 yrs) --rank histograms show “under-variance” Mean-Square-Error of the Ensemble-Mean shows skill out to 7-8 days
A Cautionary Warning about using Probabilistic Precipitation Forecasts in Hydrologic Modeling (Importance of Maintaining Spatial and Temporal Covariances for Hydrologic Forecasting) ensemble1 ensemble2 ensemble3 River catchtment A subC subB QC QB QA QA same For all 3 possible ensembles Scenario for smallest possible QA? No. Scenario for largest possible QA? No. Scenario for average QA?
Conclusions • Seasonal Forecasts currently have skill out to about 3 months • Possible increased lead-time skill through new statistical approach • “Downscaling” (and other methods) holds promise for increased discharge forecast skill • Caution: monthly forecasts won’t necessarily forecast extreme daily flooding